The take
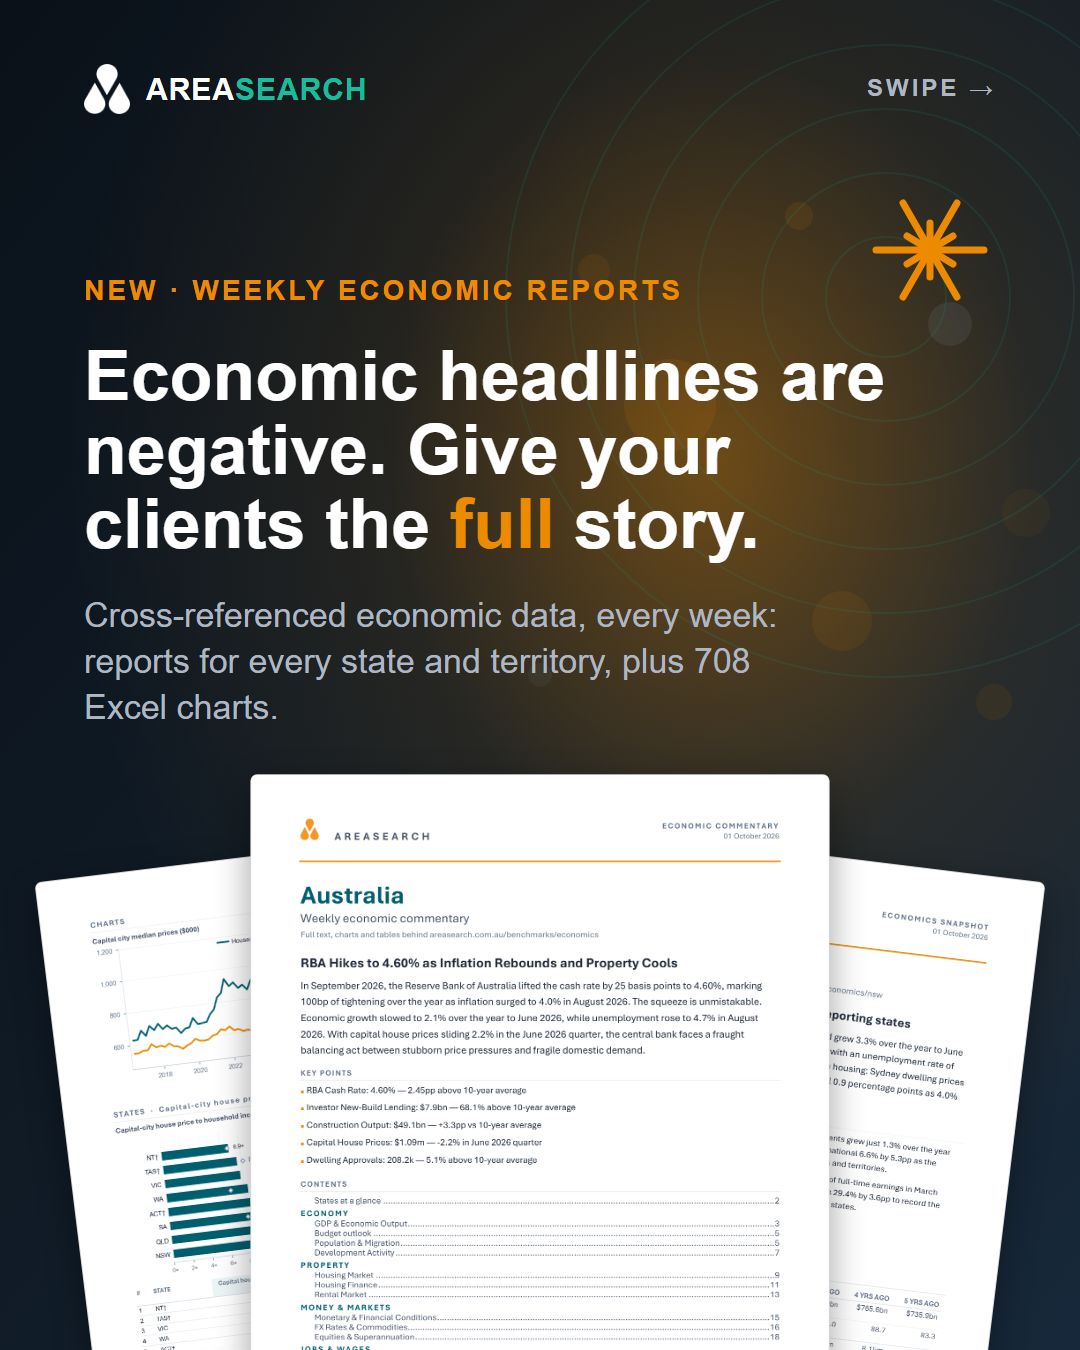
2 October 2026Our economic reports and the EcoMaster workbook are now built around one idea: cross-reference the data so you do not have to.
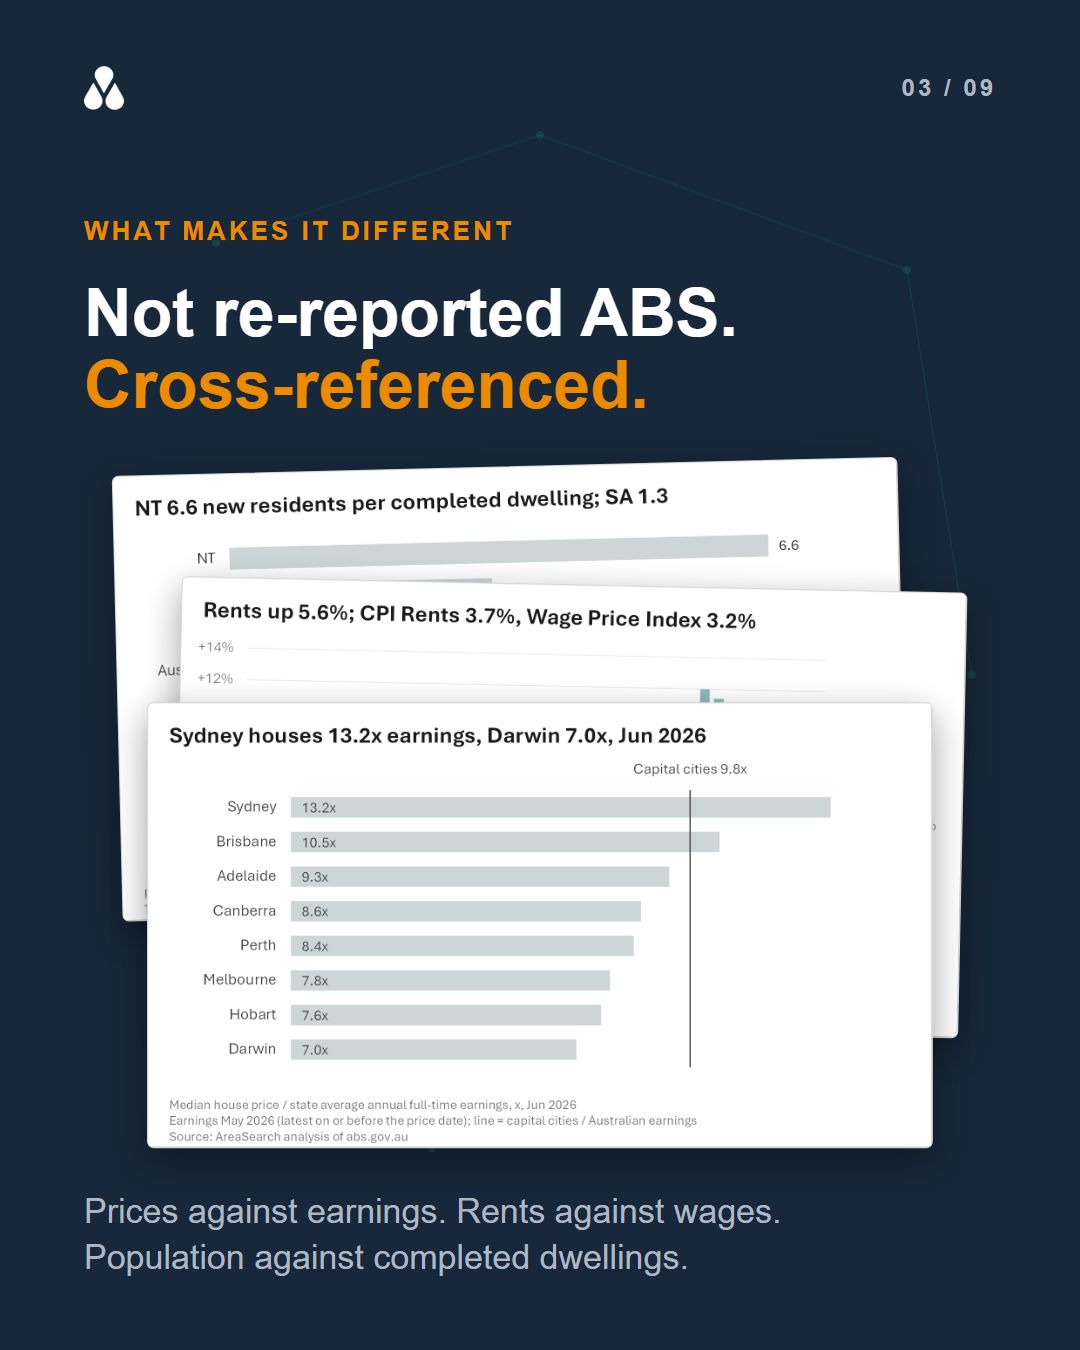
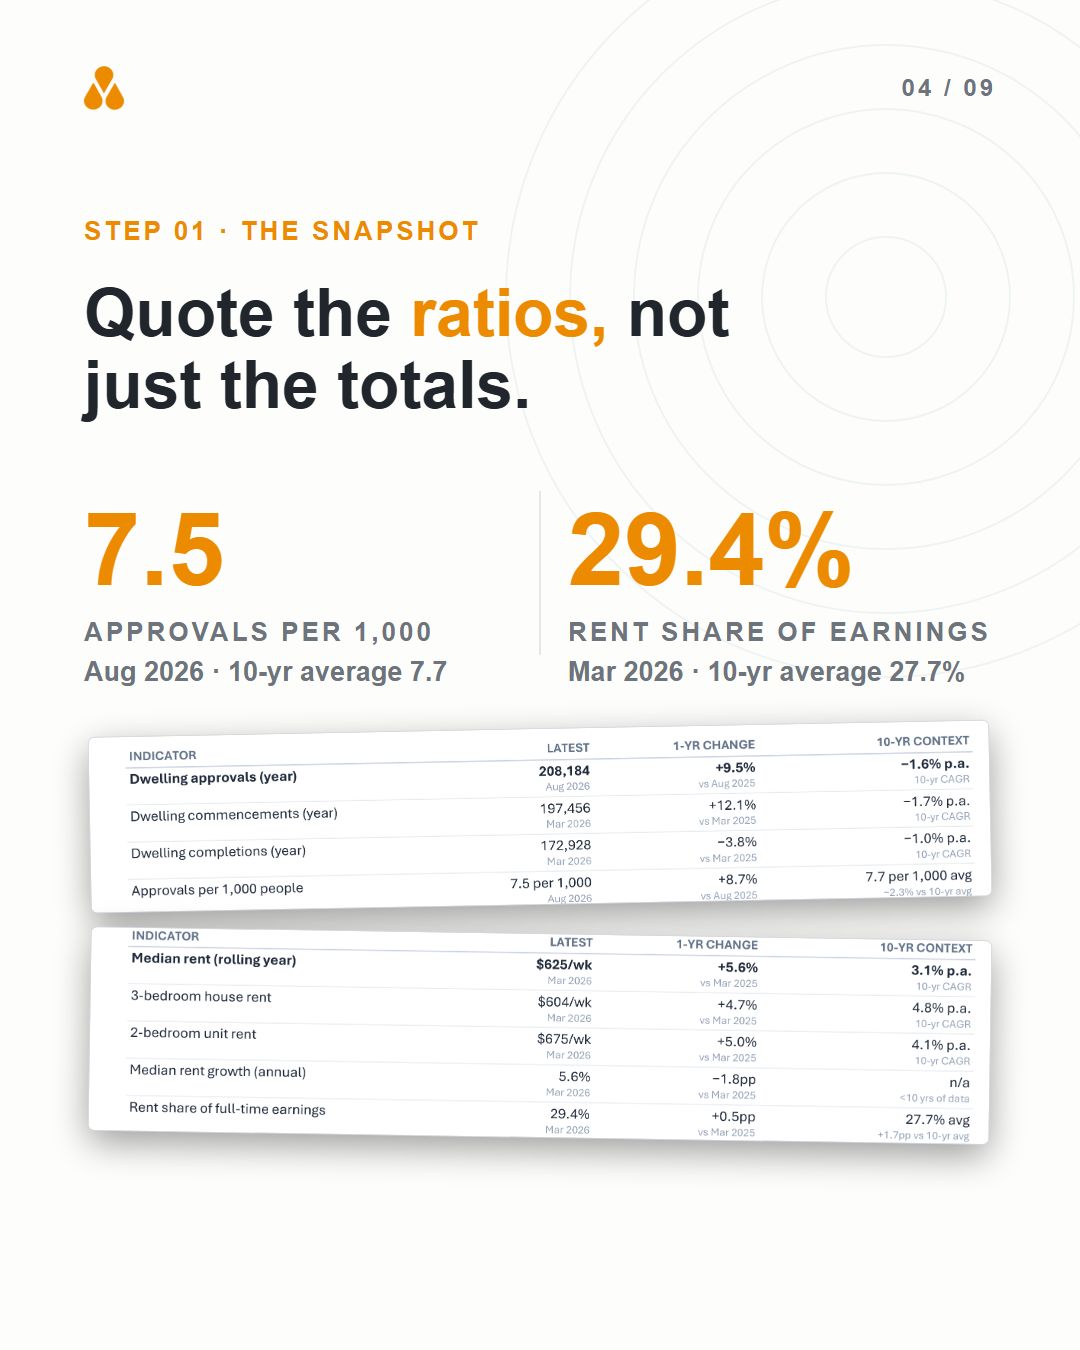
Anyone who presents a market view knows the routine. The ABS tables are in one tab, the RBA in another, and a spreadsheet sits between them working out the ratios: house prices against earnings, dwelling approvals per 1,000 residents, rent as a share of pay. We now do that work every week, for Australia and every state and territory, and each ratio sits beside its 10-year average so you can see whether it is high or low.
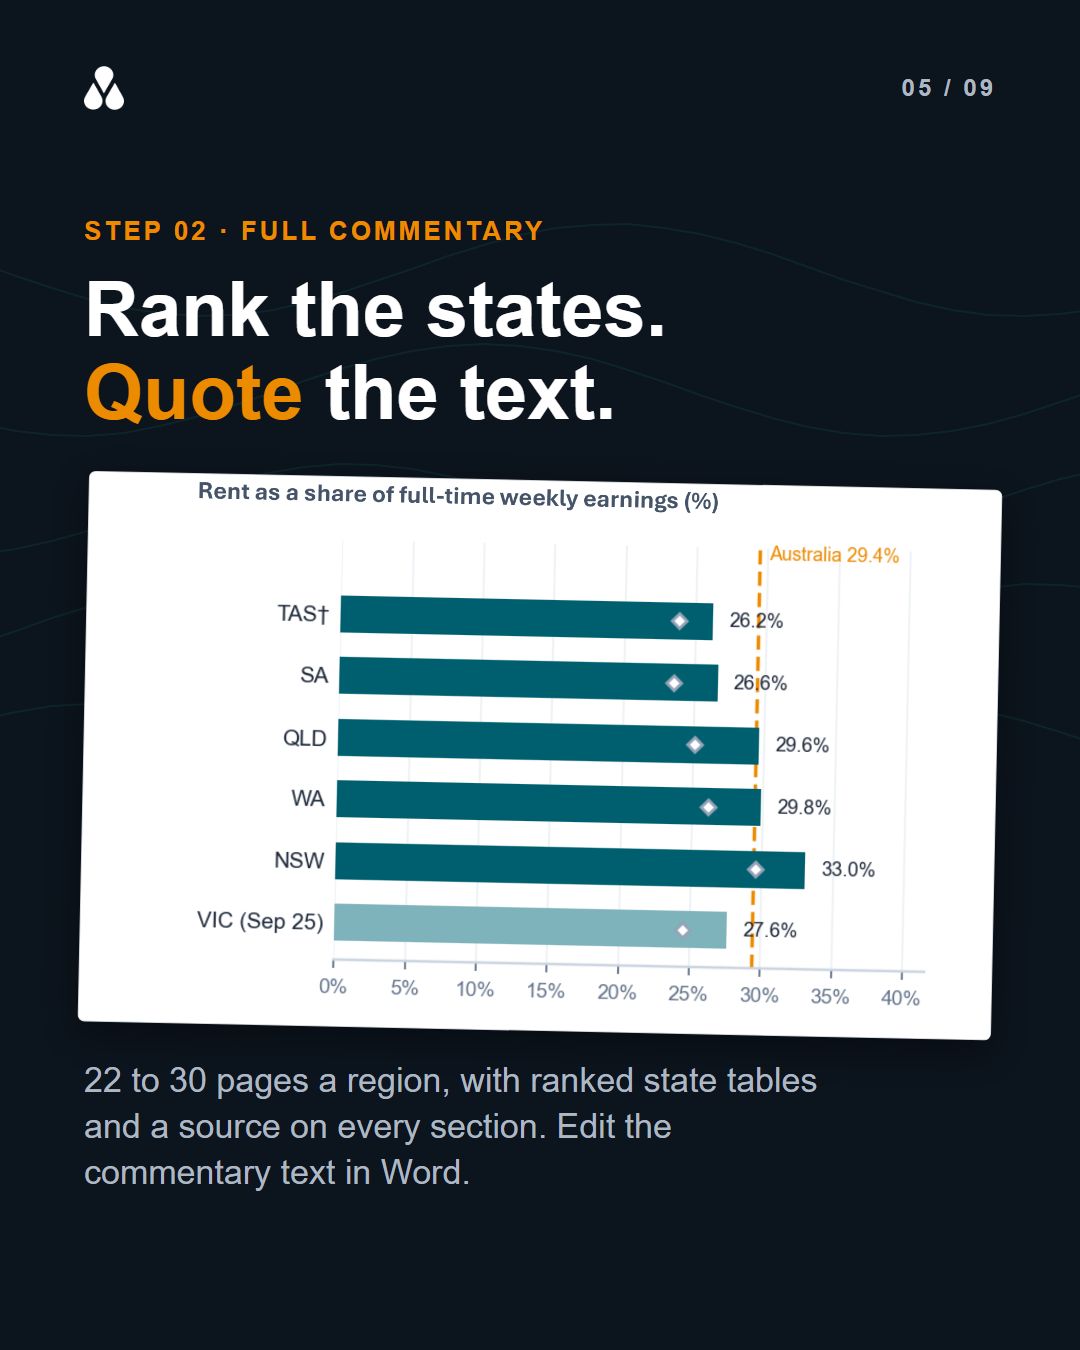
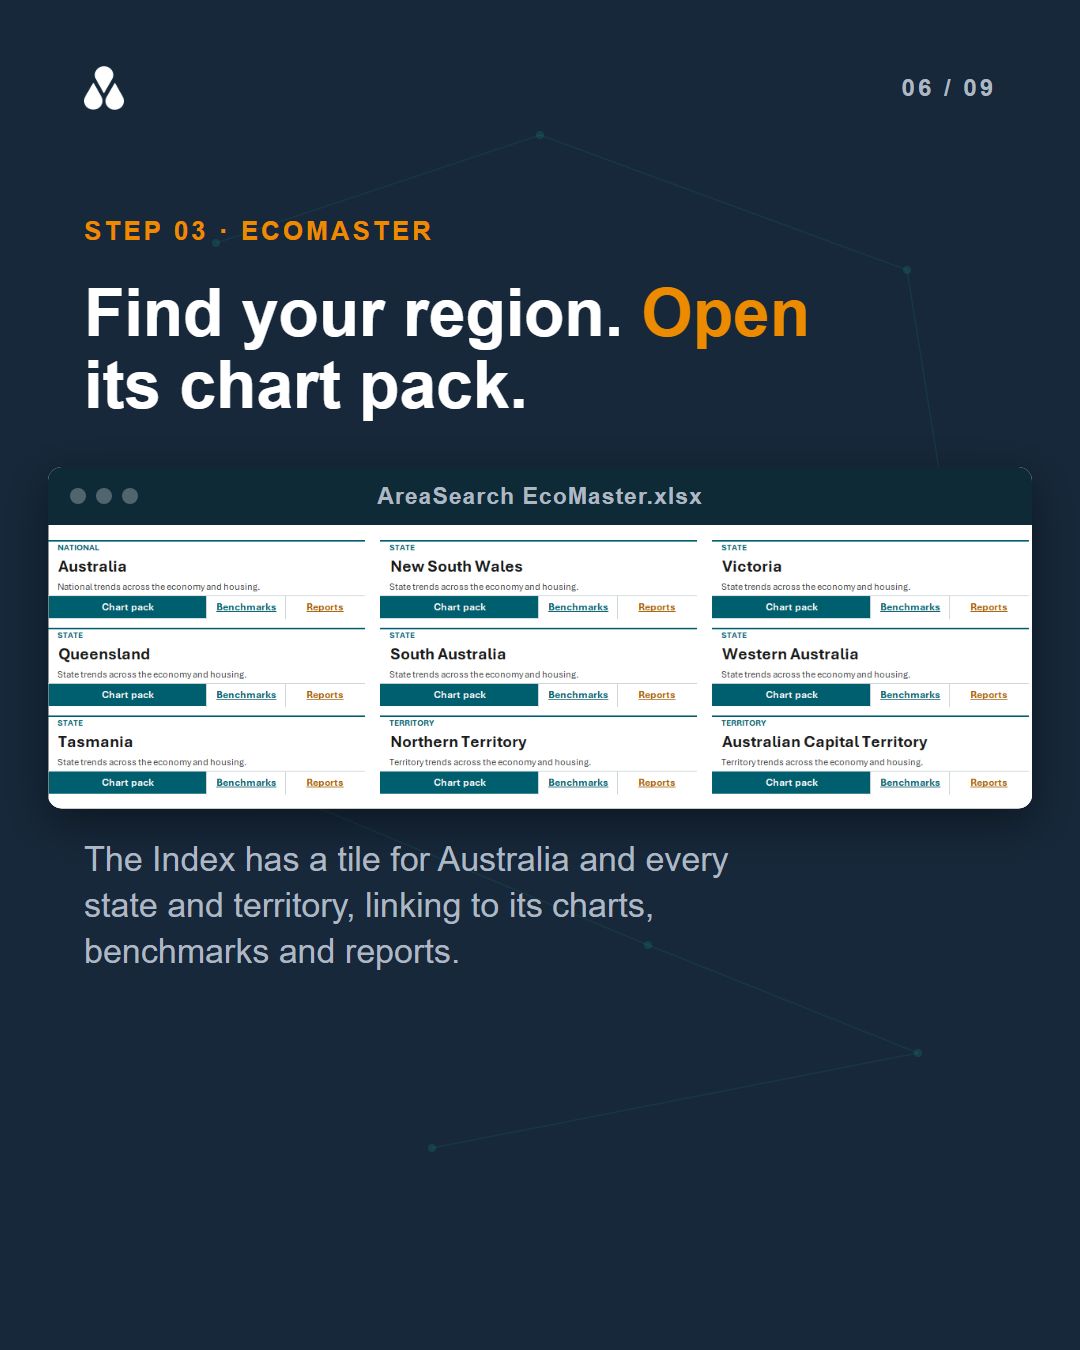
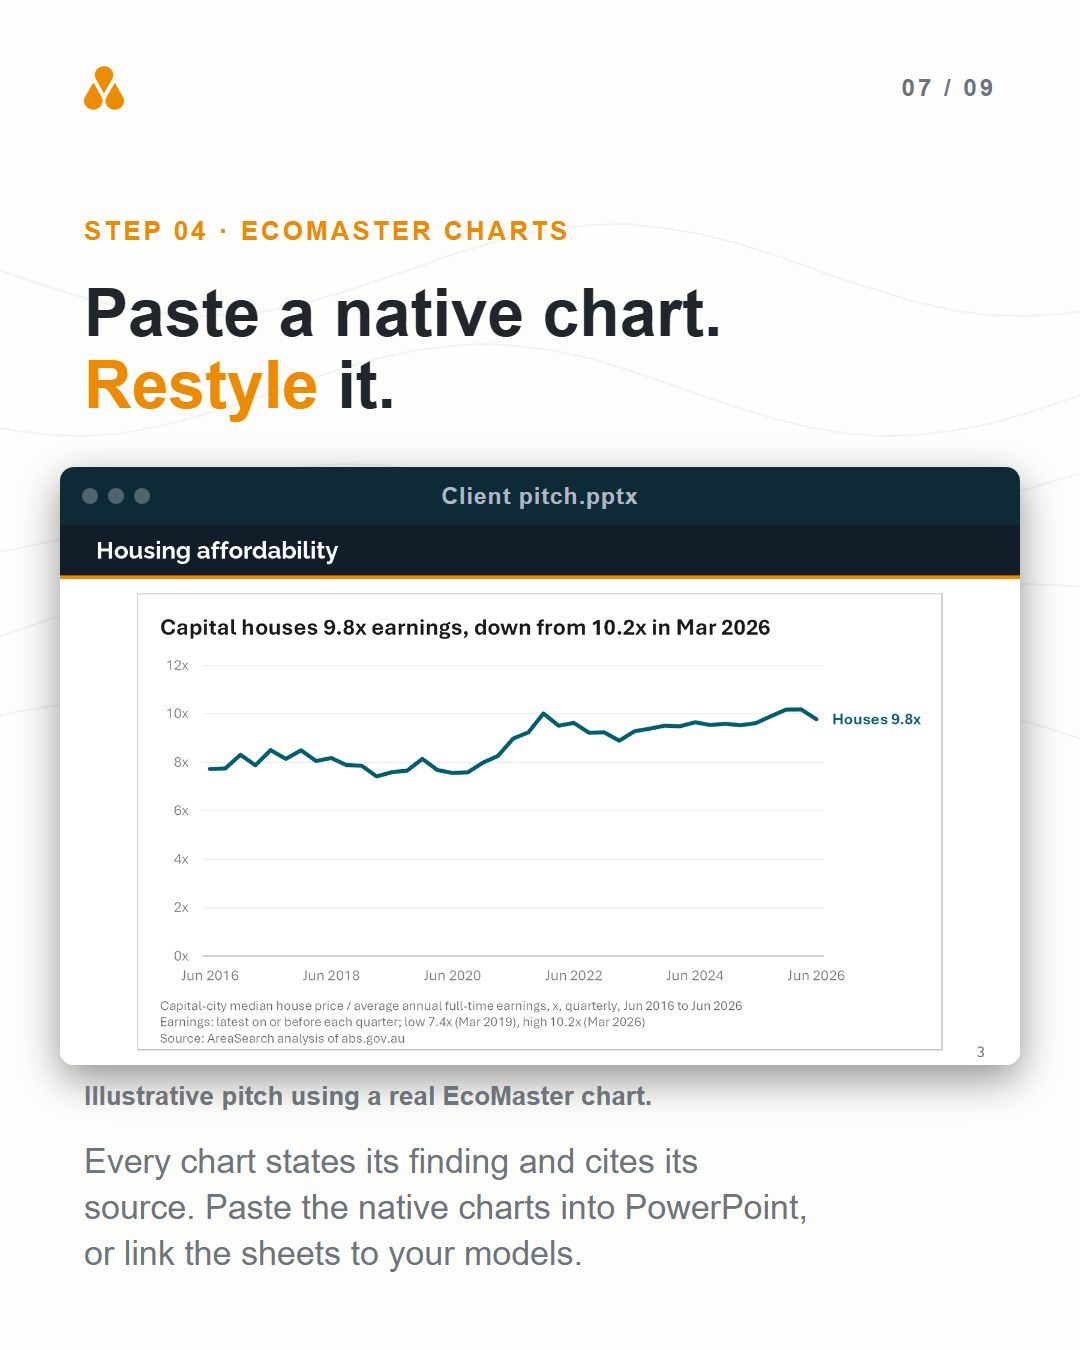
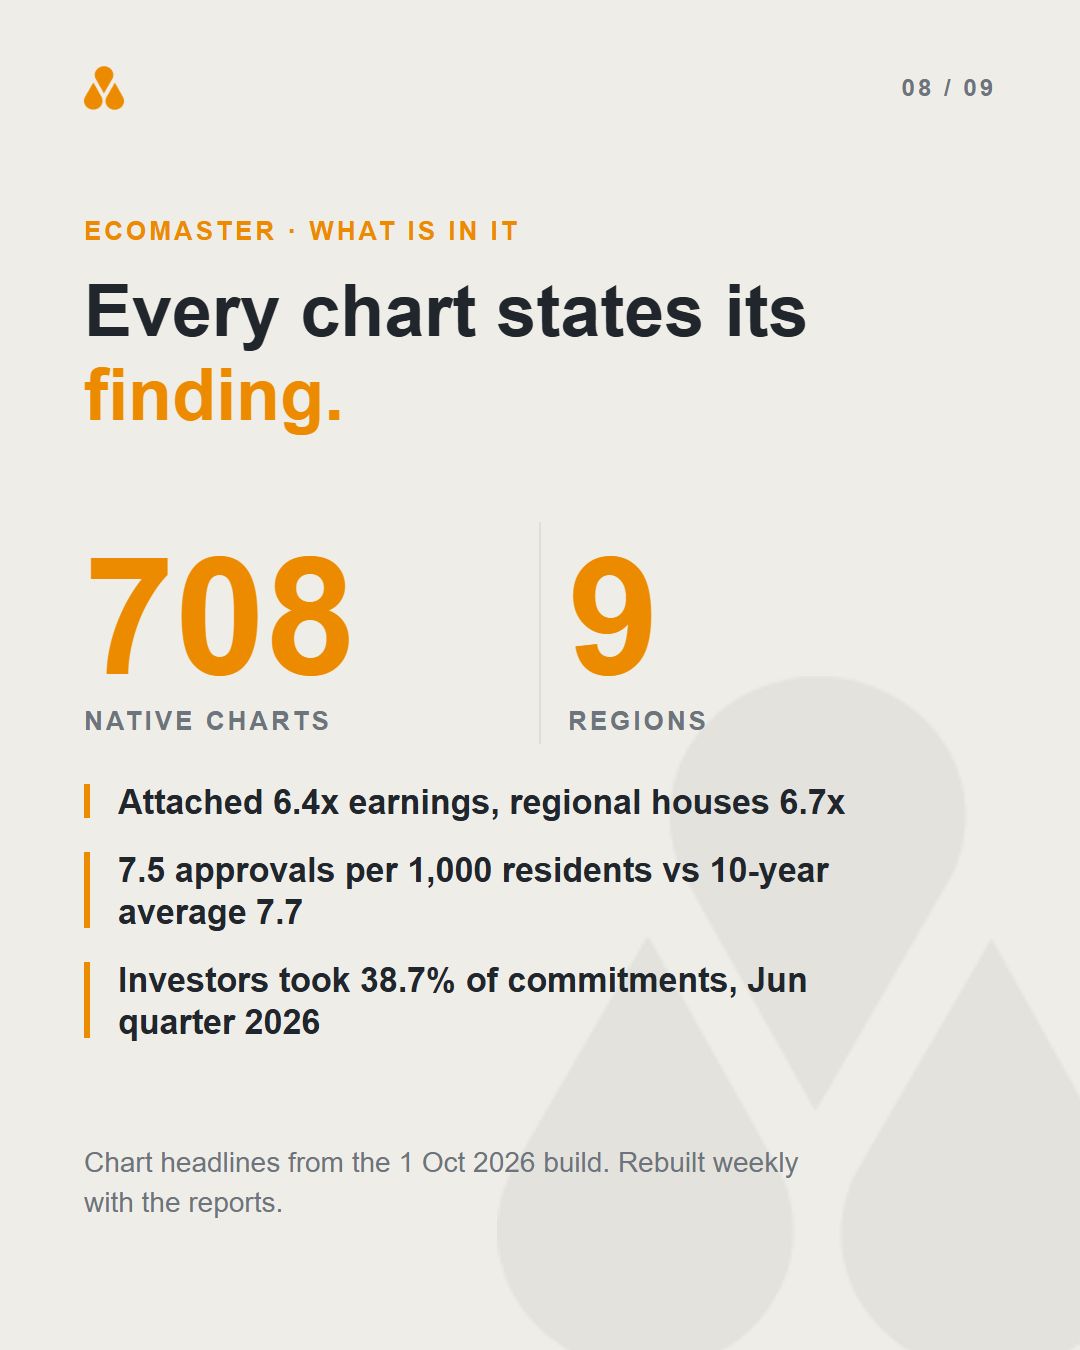
There are two ways in. The weekly reports come as a Snapshot and a Full commentary for each of the nine regions, in PDF and Word, with a source on every section. They are on the Operator plan. EcoMaster is an Excel workbook of 29 sheets and 708 native charts, each one headlined with its finding, so you can paste a chart straight into your deck and restyle it, or link the sheets to your own models. It is on the Professional plan.
Building this post, what stood out was how much of the value sits in the headlines. A chart titled "Sydney houses 13.2x earnings, Darwin 7.0x" is already half a slide. See both at areasearch.com.au/benchmarks/economics