Chart Color Schemes
est. as @ -- *
ABS ERP | -- people | --
2021 Census | -- people
Sales Activity
Curious about local property values? Filter the chart to assess the volume and appreciation (including resales) trends and regional comparisons, or scroll to the map below view this information at an individual property level.
Find a Recent Sale
Sales Detail
Population
Wollongong - West has seen population growth performance typically on par with national averages when looking at short and medium term trends
Wollongong - West's population is approximately 17,423 as of November 2025. This figure represents an increase of 872 people since the 2021 Census, which recorded a population of 16,551. The growth is inferred from ABS estimates: Wollongong - West's population was around 17,352 in June 2024, with an additional 157 validated new addresses since the Census date. This results in a population density ratio of 3,078 persons per square kilometer, placing it in the upper quartile nationally according to AreaSearch's assessments. Wollongong - West's growth rate of 5.3% since the 2021 Census exceeded both its SA3 area (4.0%) and non-metro areas, indicating strong population growth in the region. Overseas migration contributed approximately 84.8% of overall population gains during recent periods.
AreaSearch uses ABS/Geoscience Australia projections for each SA2 area, released in 2024 with a base year of 2022, and NSW State Government's SA2 level projections for areas not covered by this data, released in 2022 with a base year of 2021. Growth rates by age group are applied to all areas from these aggregations for years 2032 to 2041. By 2041, Wollongong - West's population is forecasted to increase by 6,000 persons based on the latest annual ERP population numbers, reflecting a total gain of 34.0% over the 17 years.
Frequently Asked Questions - Population
Development
AreaSearch analysis of residential development drivers sees Wollongong - West recording a relatively average level of approval activity when compared to local markets analysed countrywide
Wollongong - West saw approximately 81 new homes approved annually over the past five financial years, totaling 408 homes from FY21 to FY25. An additional 4 homes have been approved in FY26 so far. The average population increase per dwelling built during this period was 0.2 people per year.
This suggests that new supply has kept pace with or exceeded demand, providing ample buyer choice and capacity for population growth beyond current forecasts. The average construction value of these properties was $582,000, which is moderately above regional levels, indicating a focus on quality construction. In FY26, $28.3 million in commercial approvals have been registered, suggesting balanced commercial development activity compared to the rest of NSW. However, Wollongong - West has 17.0% less new development per person when measured against Rest of NSW and ranks at the 49th percentile nationally, resulting in relatively constrained buyer choice and supporting interest in existing dwellings. New building activity in Wollongong - West is predominantly medium to high-density housing, with 80.0% of approvals falling into this category, while detached houses account for 20.0%.
This shift from the area's current housing composition (48.0% houses) indicates decreasing availability of developable sites and reflects changing lifestyles and demand for more diverse, affordable housing options. With around 336 people per dwelling approval, Wollongong - West exhibits characteristics of a low-density area. According to AreaSearch's latest quarterly estimate, the area is forecasted to gain approximately 5,929 residents by 2041. If current development rates continue, housing supply may struggle to match population growth, potentially heightening buyer competition and supporting price increases.
Frequently Asked Questions - Development
Infrastructure
Wollongong - West has very high levels of nearby infrastructure activity, ranking in the top 20% nationally
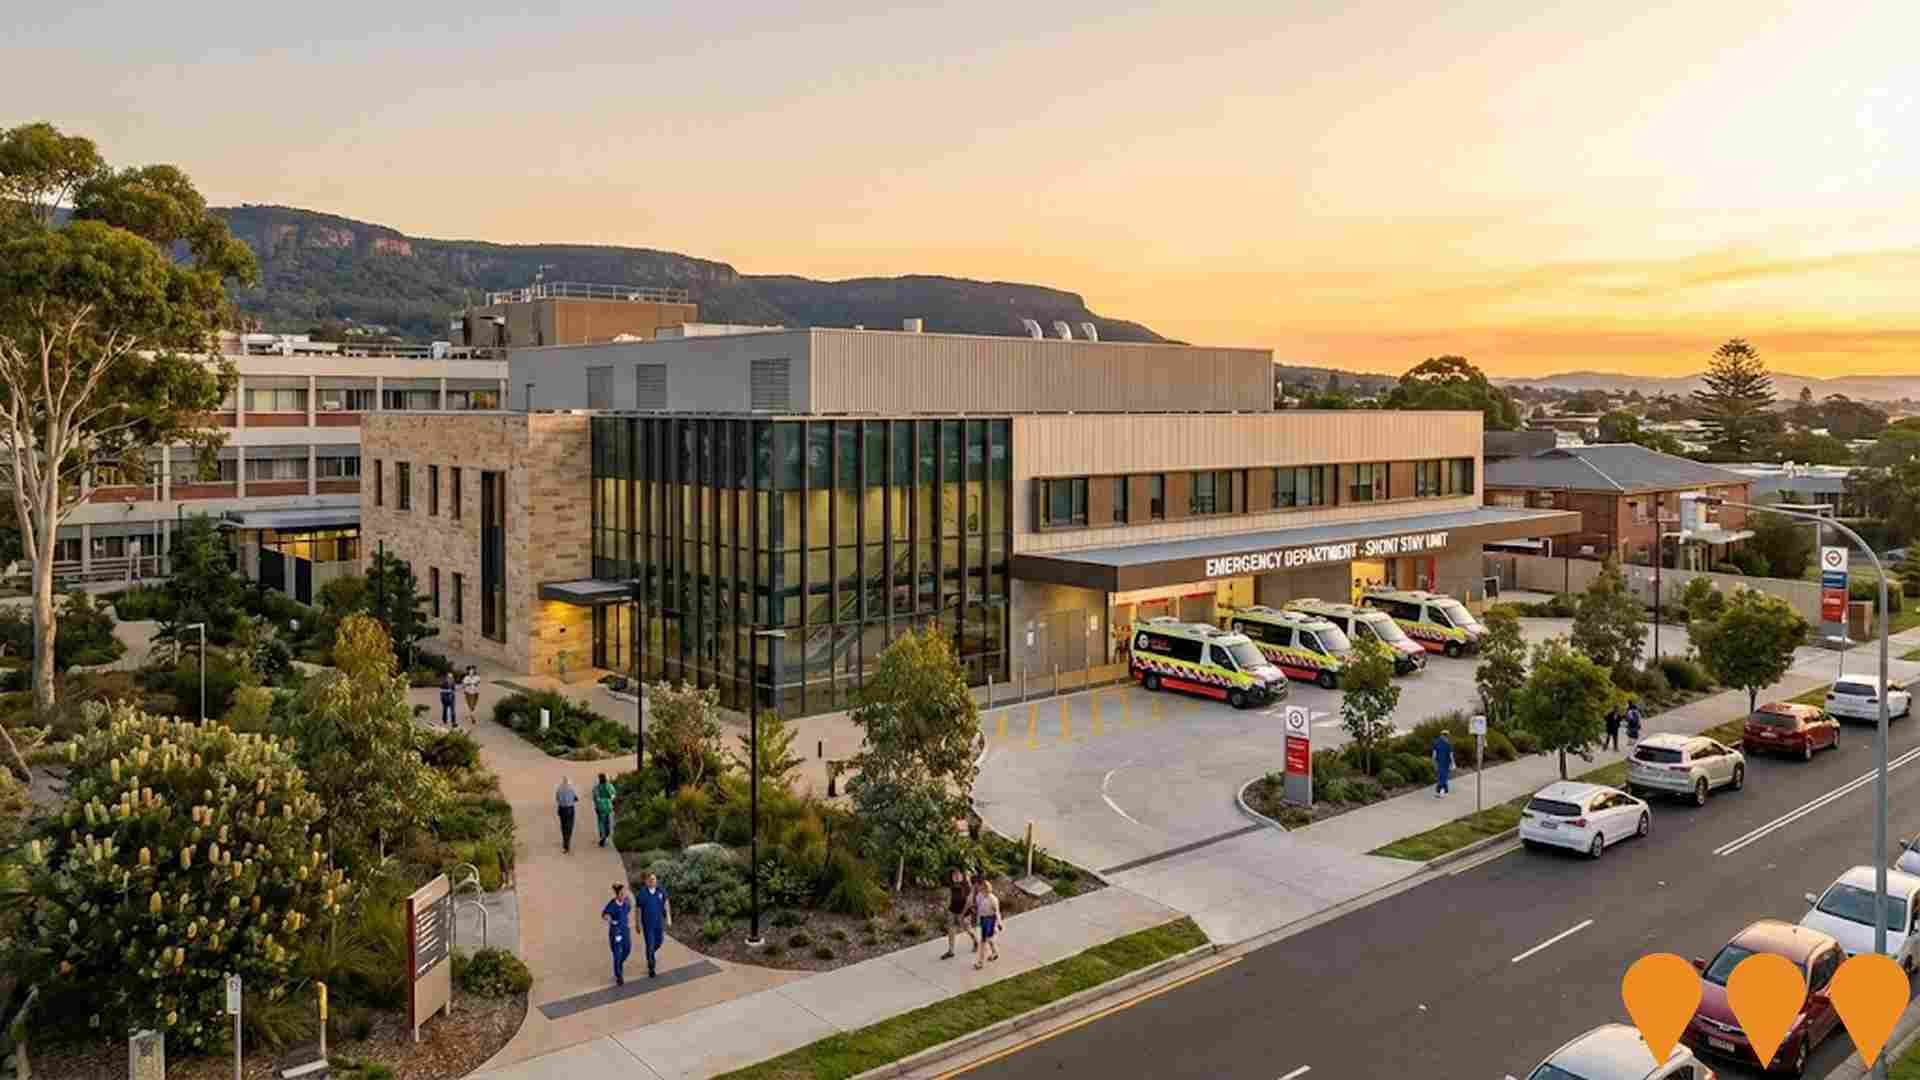
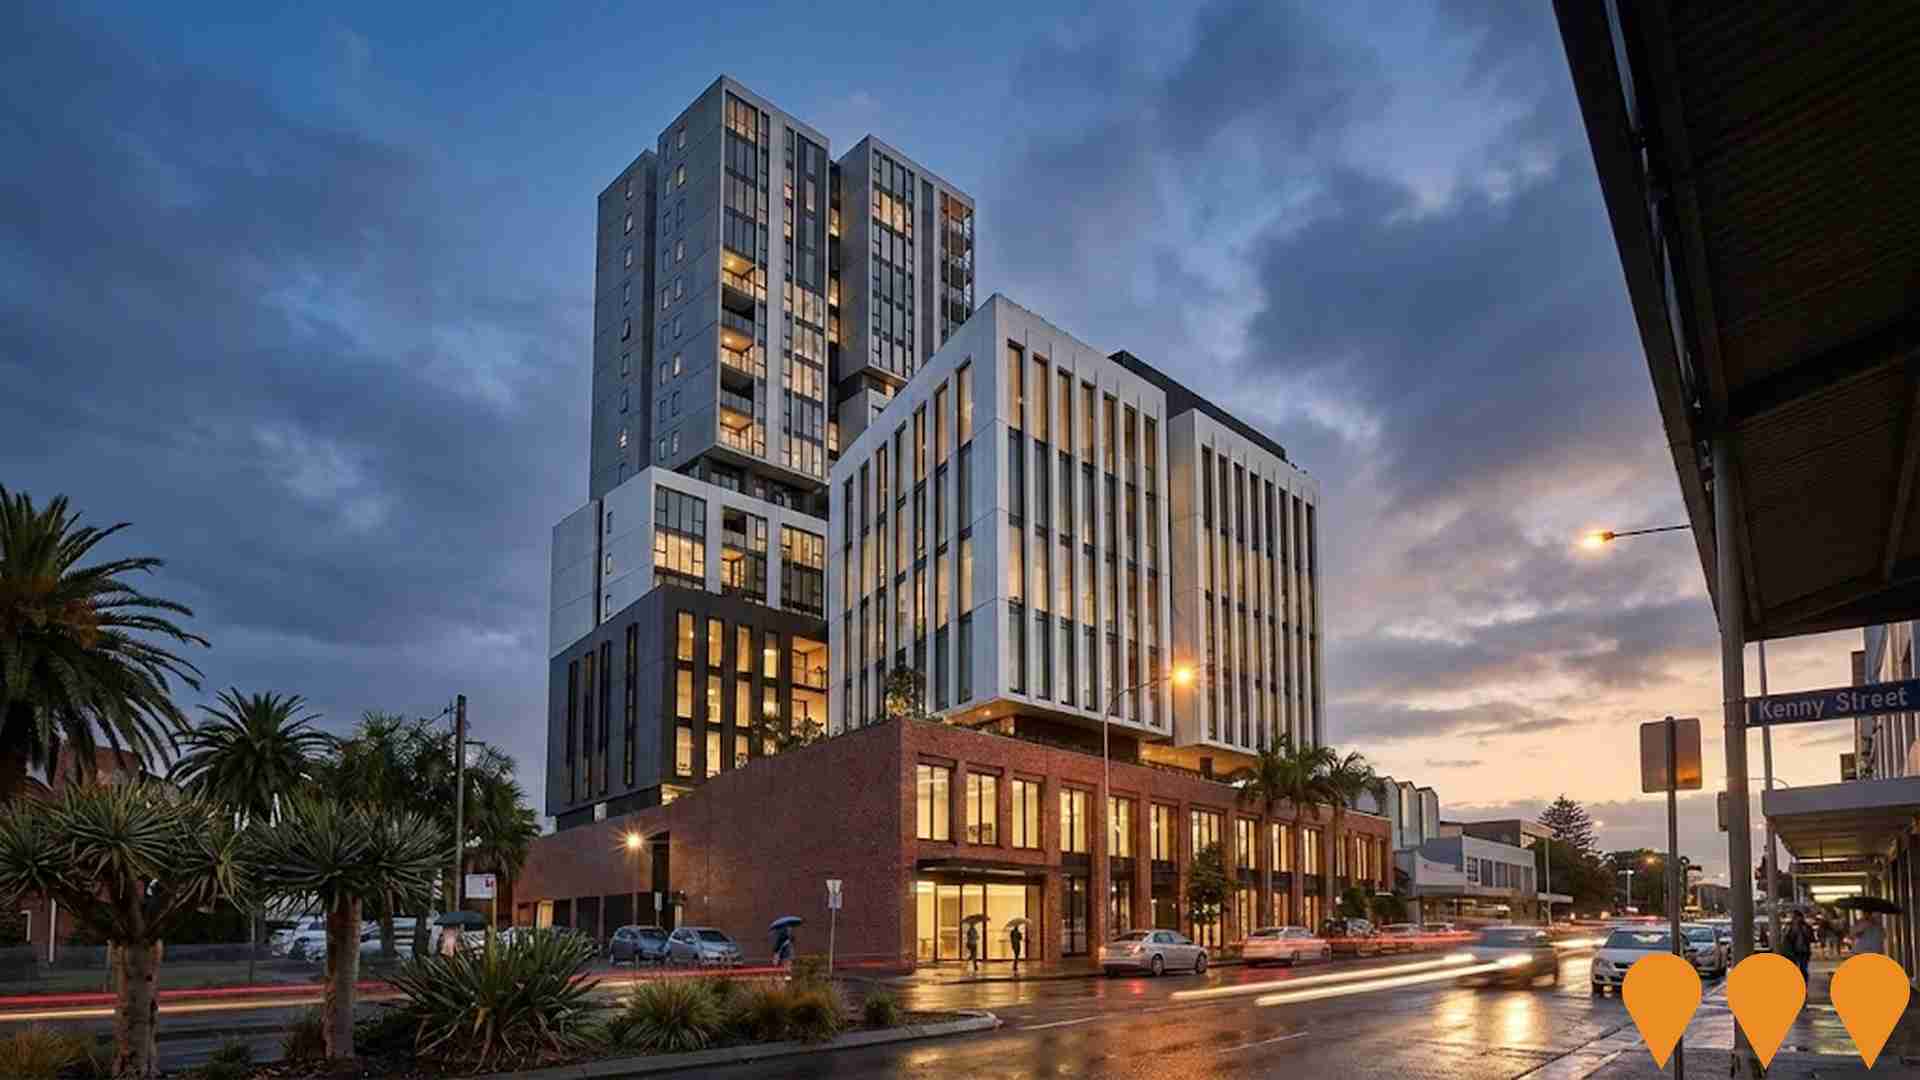
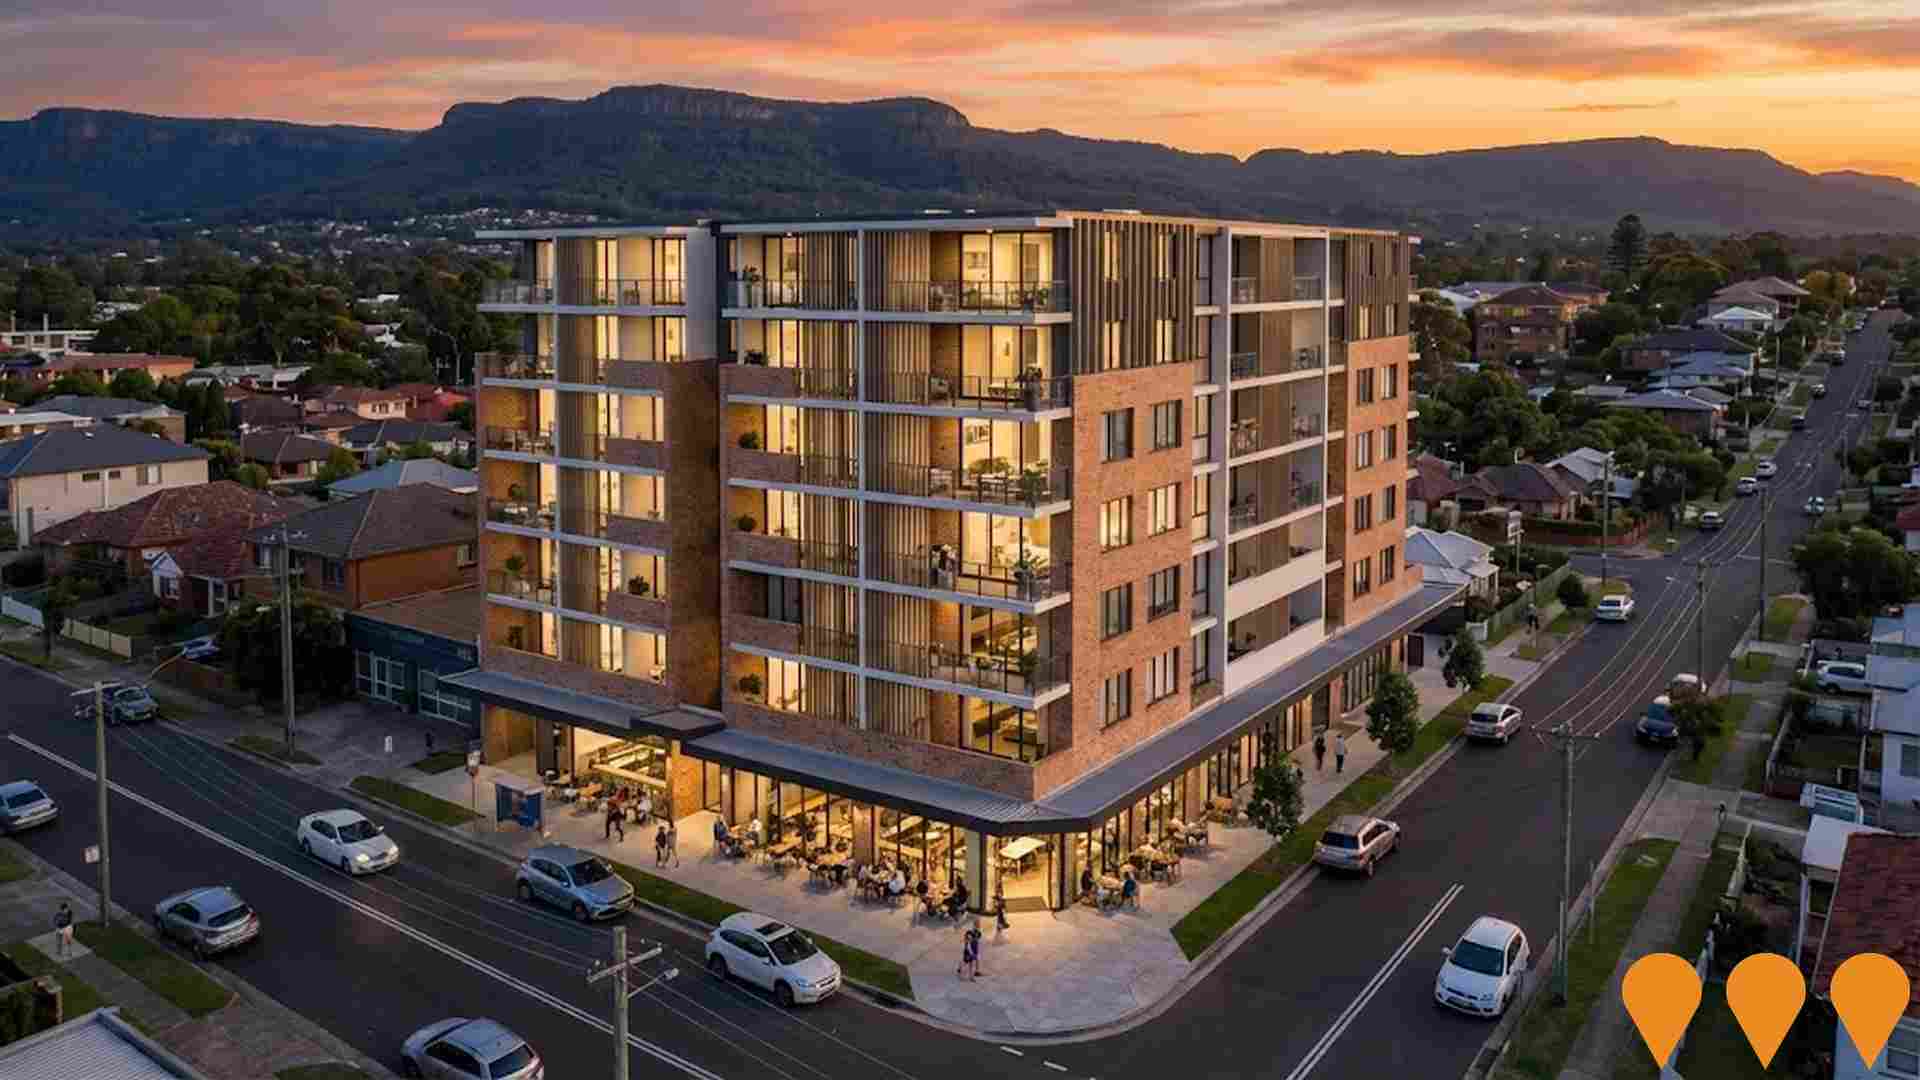
Changes to local infrastructure significantly impact an area's performance. AreaSearch has identified 28 projects likely to influence the area. Notable projects include Wollongong Hospital Redevelopment - Planning and Equipment Upgrades, Wollongong Health Precinct Strategy, Kenny Street Mixed-Use Tower, and Wollongong Hospital ED Short Stay Units. The following list details those most relevant.
Professional plan users can use the search below to filter and access additional projects.
INFRASTRUCTURE SEARCH
 Denotes AI-based impression for illustrative purposes only, not to be taken as definitive under any circumstances. Please follow links and conduct other investigations from the project's source for actual imagery. Developers and project owners wishing us to use original imagery please Contact Us and we will do so.
Frequently Asked Questions - Infrastructure
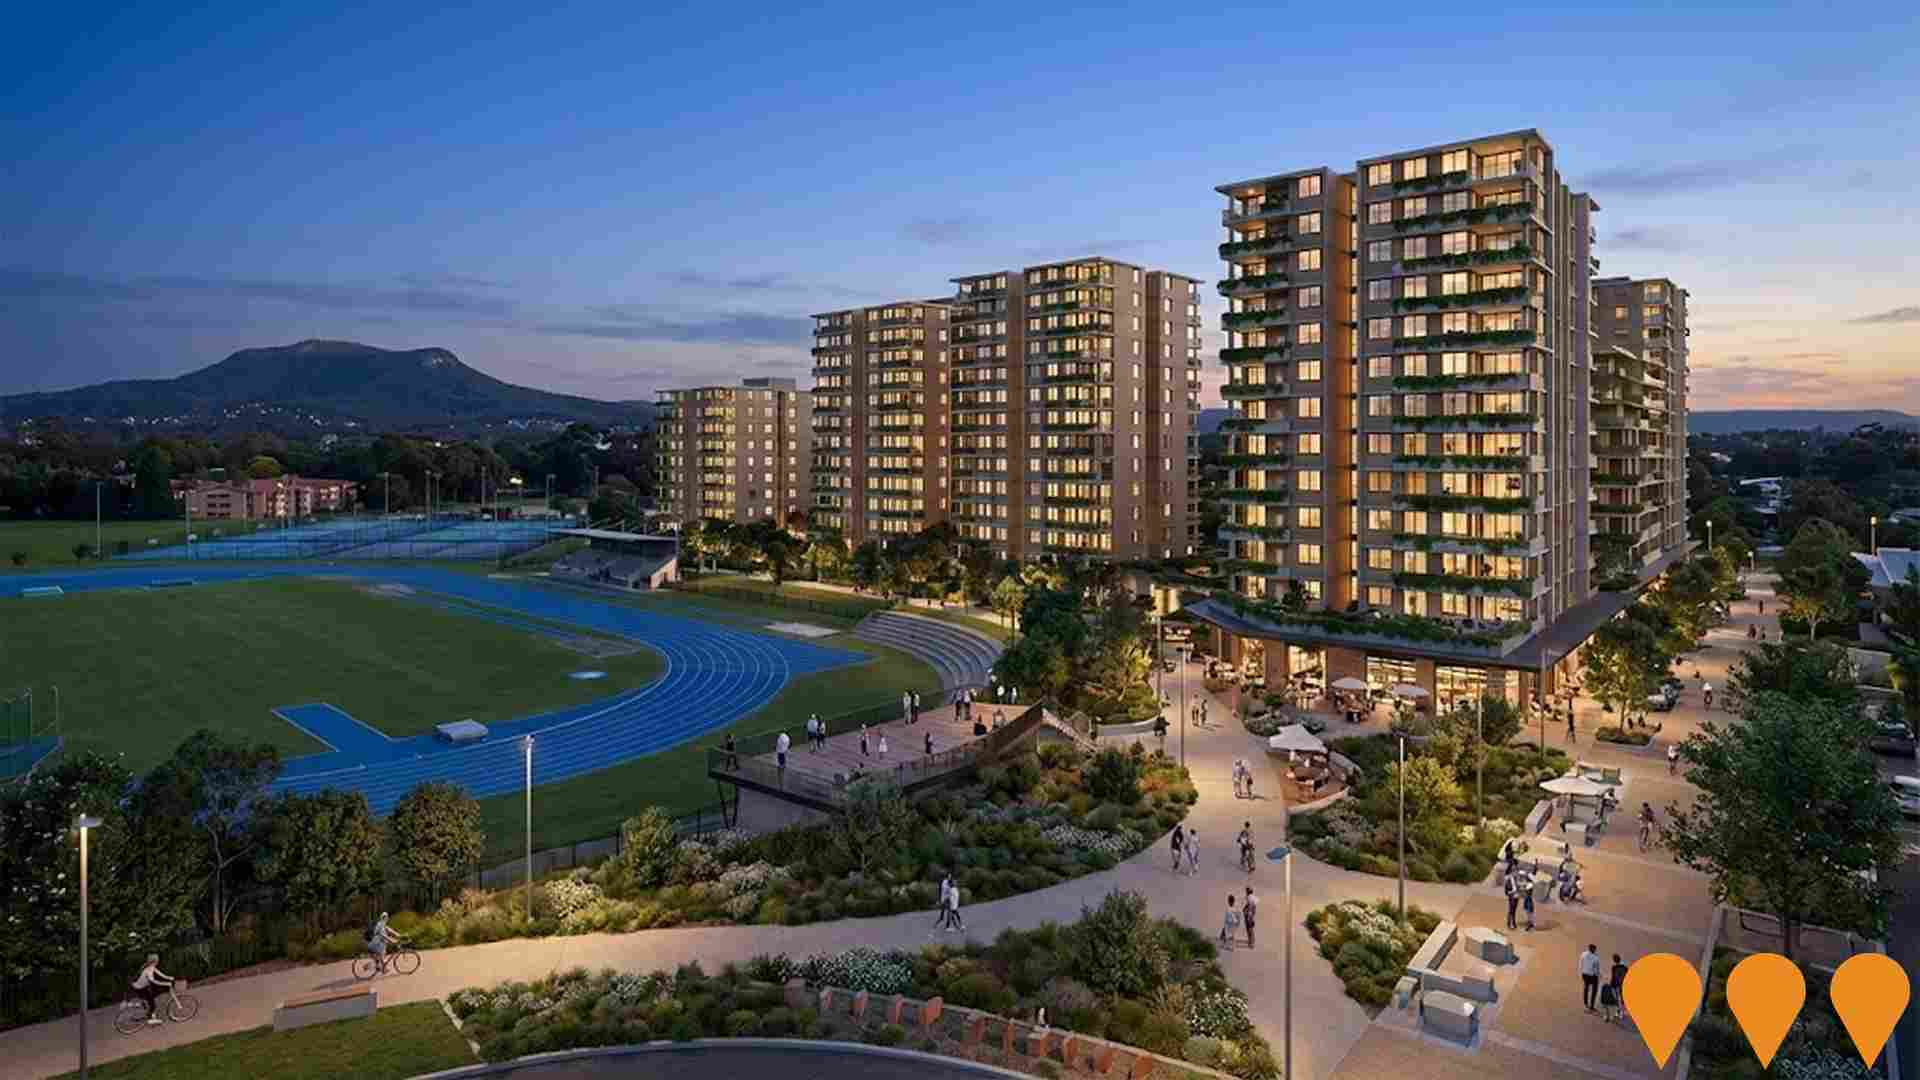
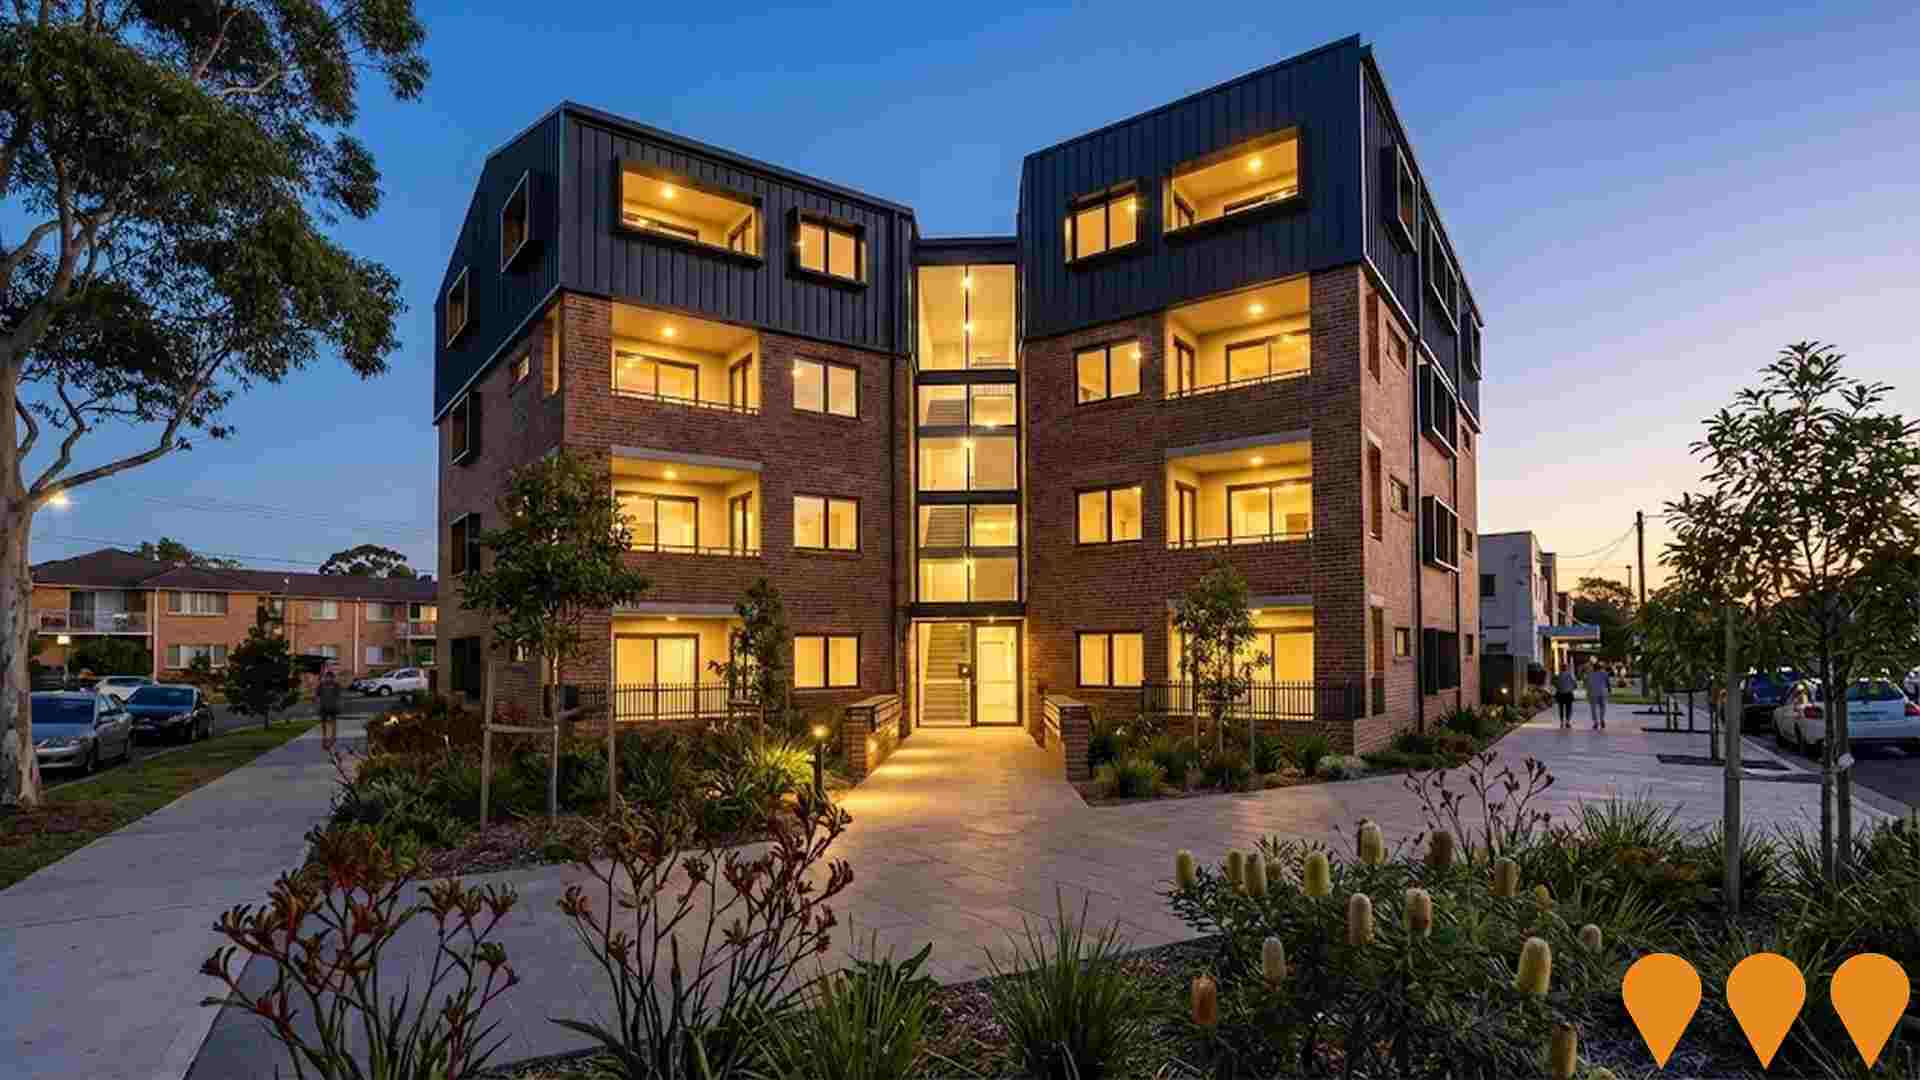
Irvine Street Gwynneville Precinct Planning Proposal
Planning Proposal lodged by Homes NSW to rezone the precinct for urban renewal, enabling up to 1,250 homes (3-6 storeys), with 50% dedicated to social and affordable housing, and new public open space. The proposal is currently under public exhibition and assessment by Wollongong City Council after receiving a Gateway Determination from the NSW Department of Planning, Housing and Infrastructure.
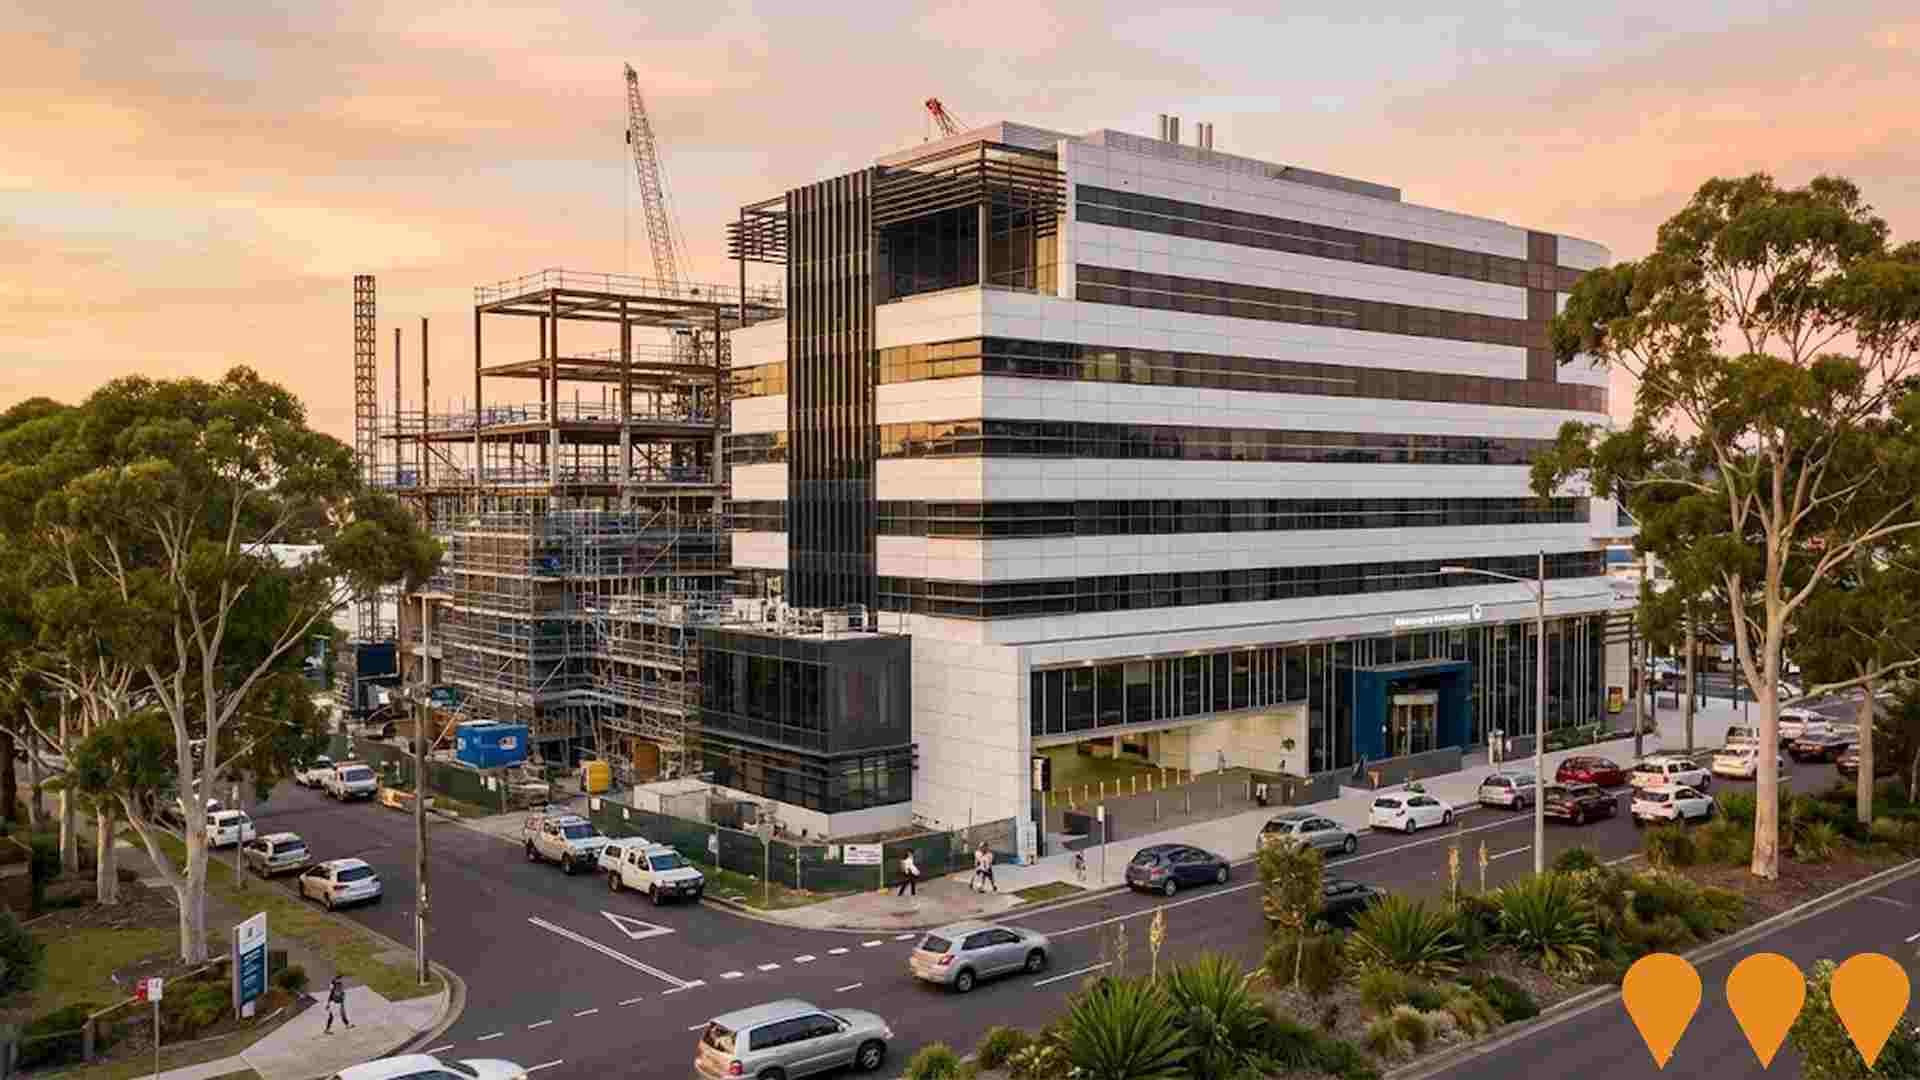
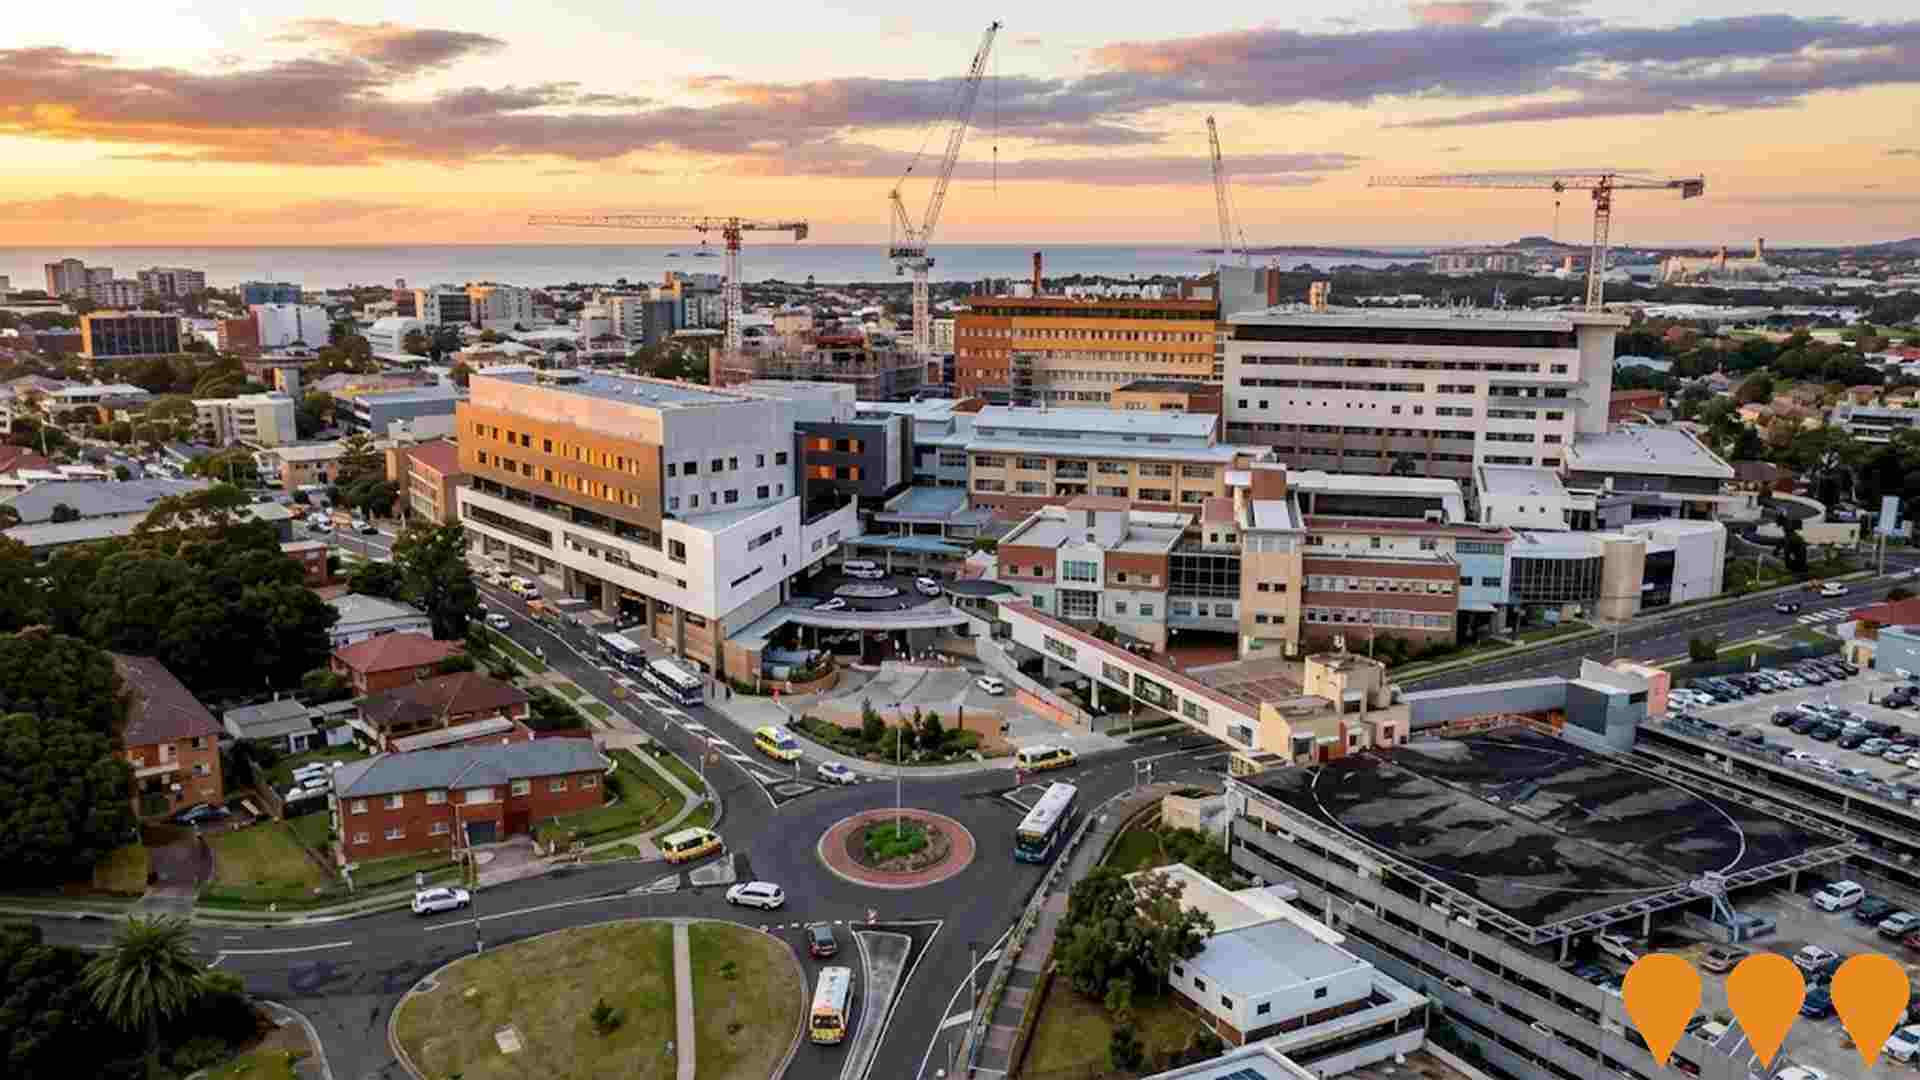
Wollongong Hospital Redevelopment - Planning and Equipment Upgrades
NSW Government has committed $21.9 million to upgrade and expand Wollongong Hospital, including installation of an additional MRI and CT scanner, relocation and expansion of the Medical Ambulatory Care (MAC) unit, and expansion/relocation of the Emergency Short Stay Area (ESSA) to improve patient flow. Construction commenced in February 2025 with works expected to complete in early 2026. The package also funds early planning for a broader future redevelopment.

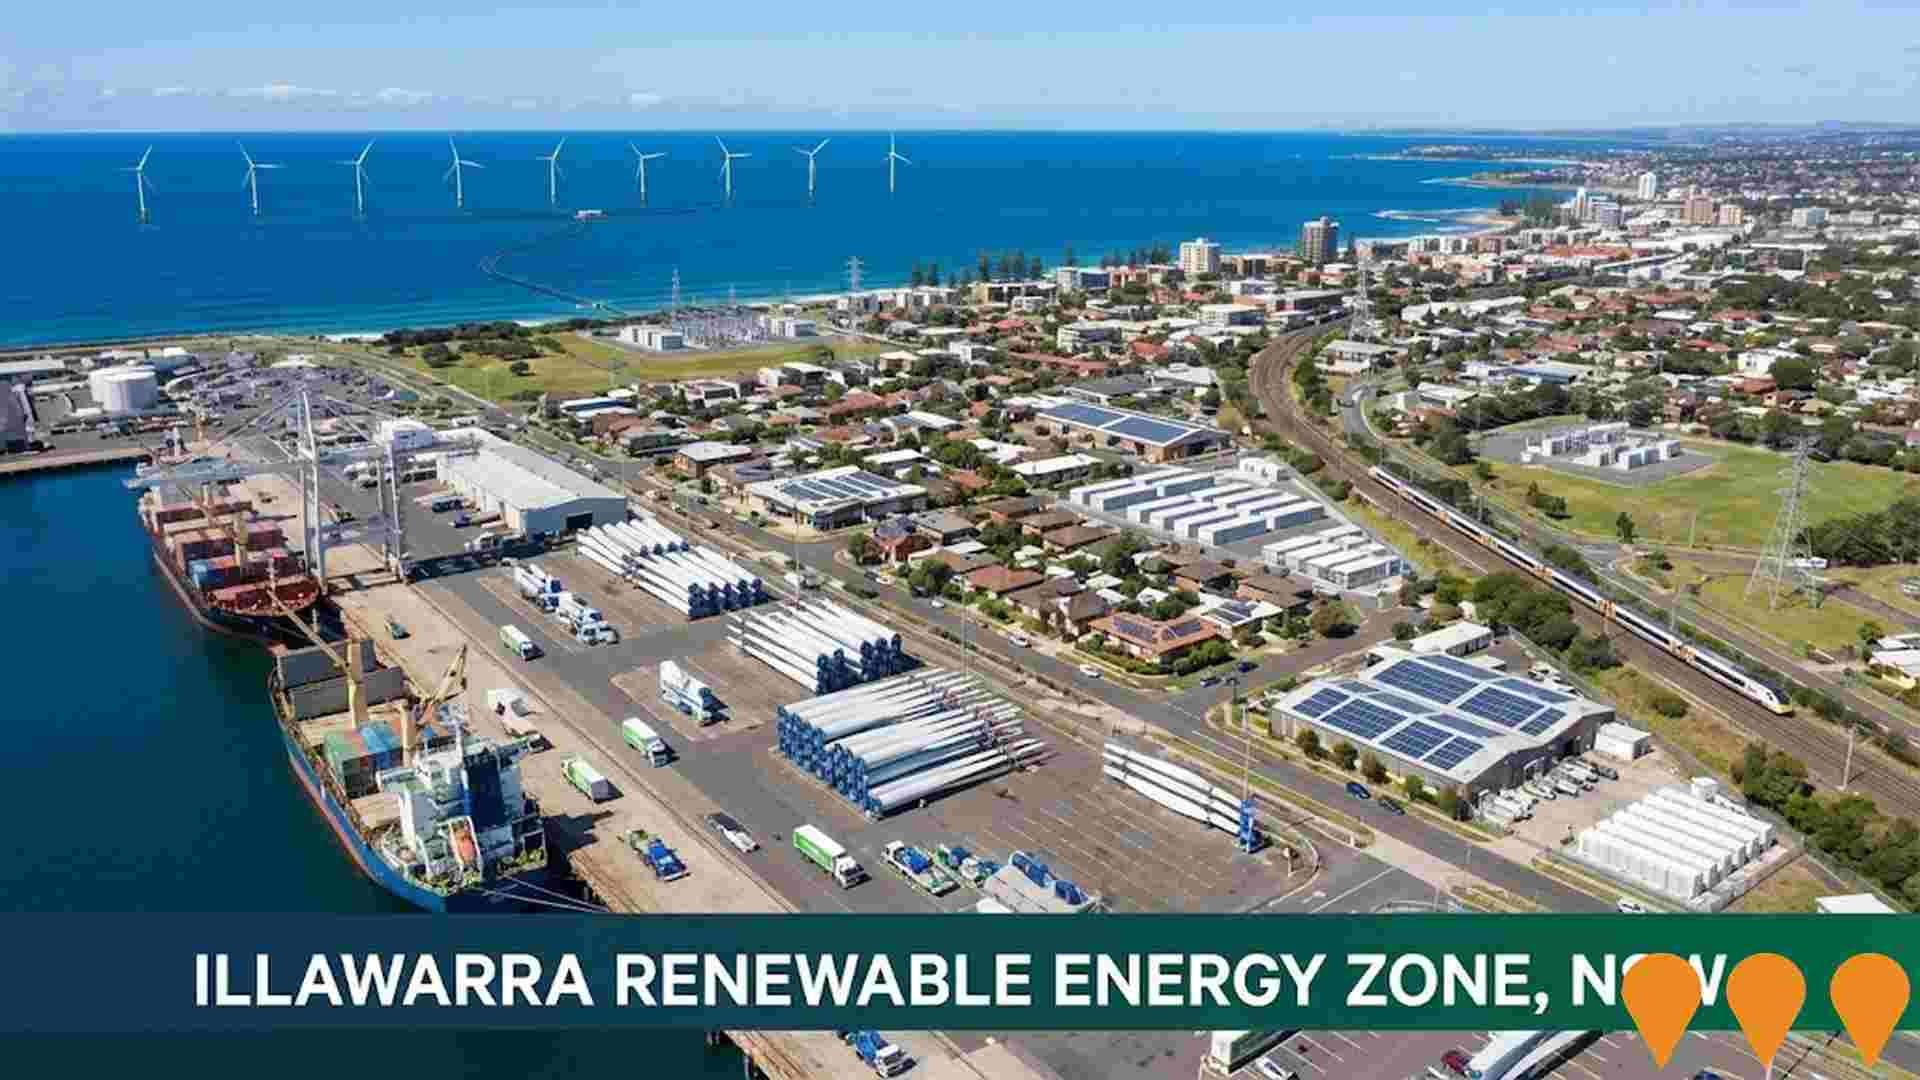
Illawarra Renewable Energy Zone (REZ)
NSW's first urban Renewable Energy Zone with an intended network capacity of 1 GW (potential to increase). Integrates consumer energy resources including rooftop solar, home batteries, and community-scale batteries while leveraging existing port, transport and grid assets to support low-carbon industries such as offshore wind, green hydrogen, and green steel manufacturing. The May 2025 Illawarra REZ Roundtable and Registration of Interest process attracted 44 projects worth over $43 billion in potential investment (including offshore wind, solar, energy storage, pumped hydro, and hydrogen). EnergyCo is the infrastructure planner, coordinating transmission upgrades in partnership with Endeavour Energy.
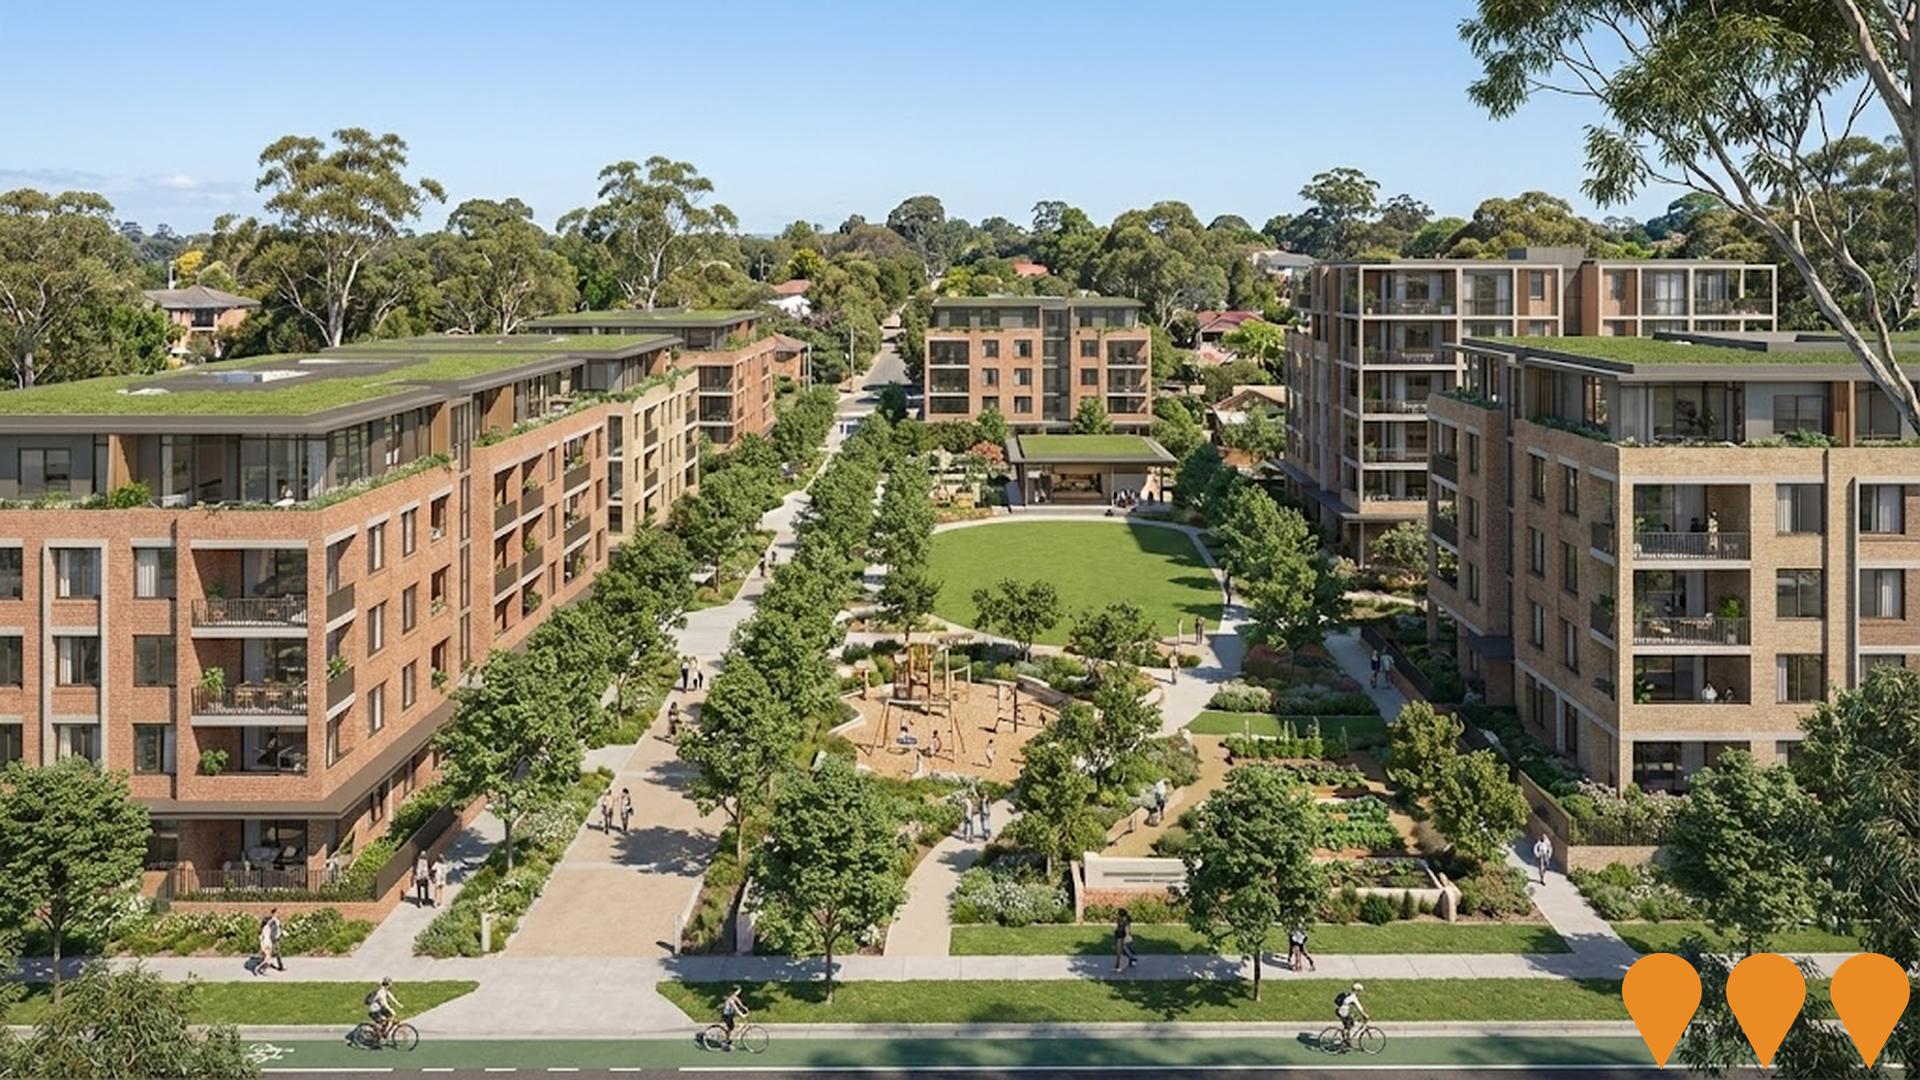
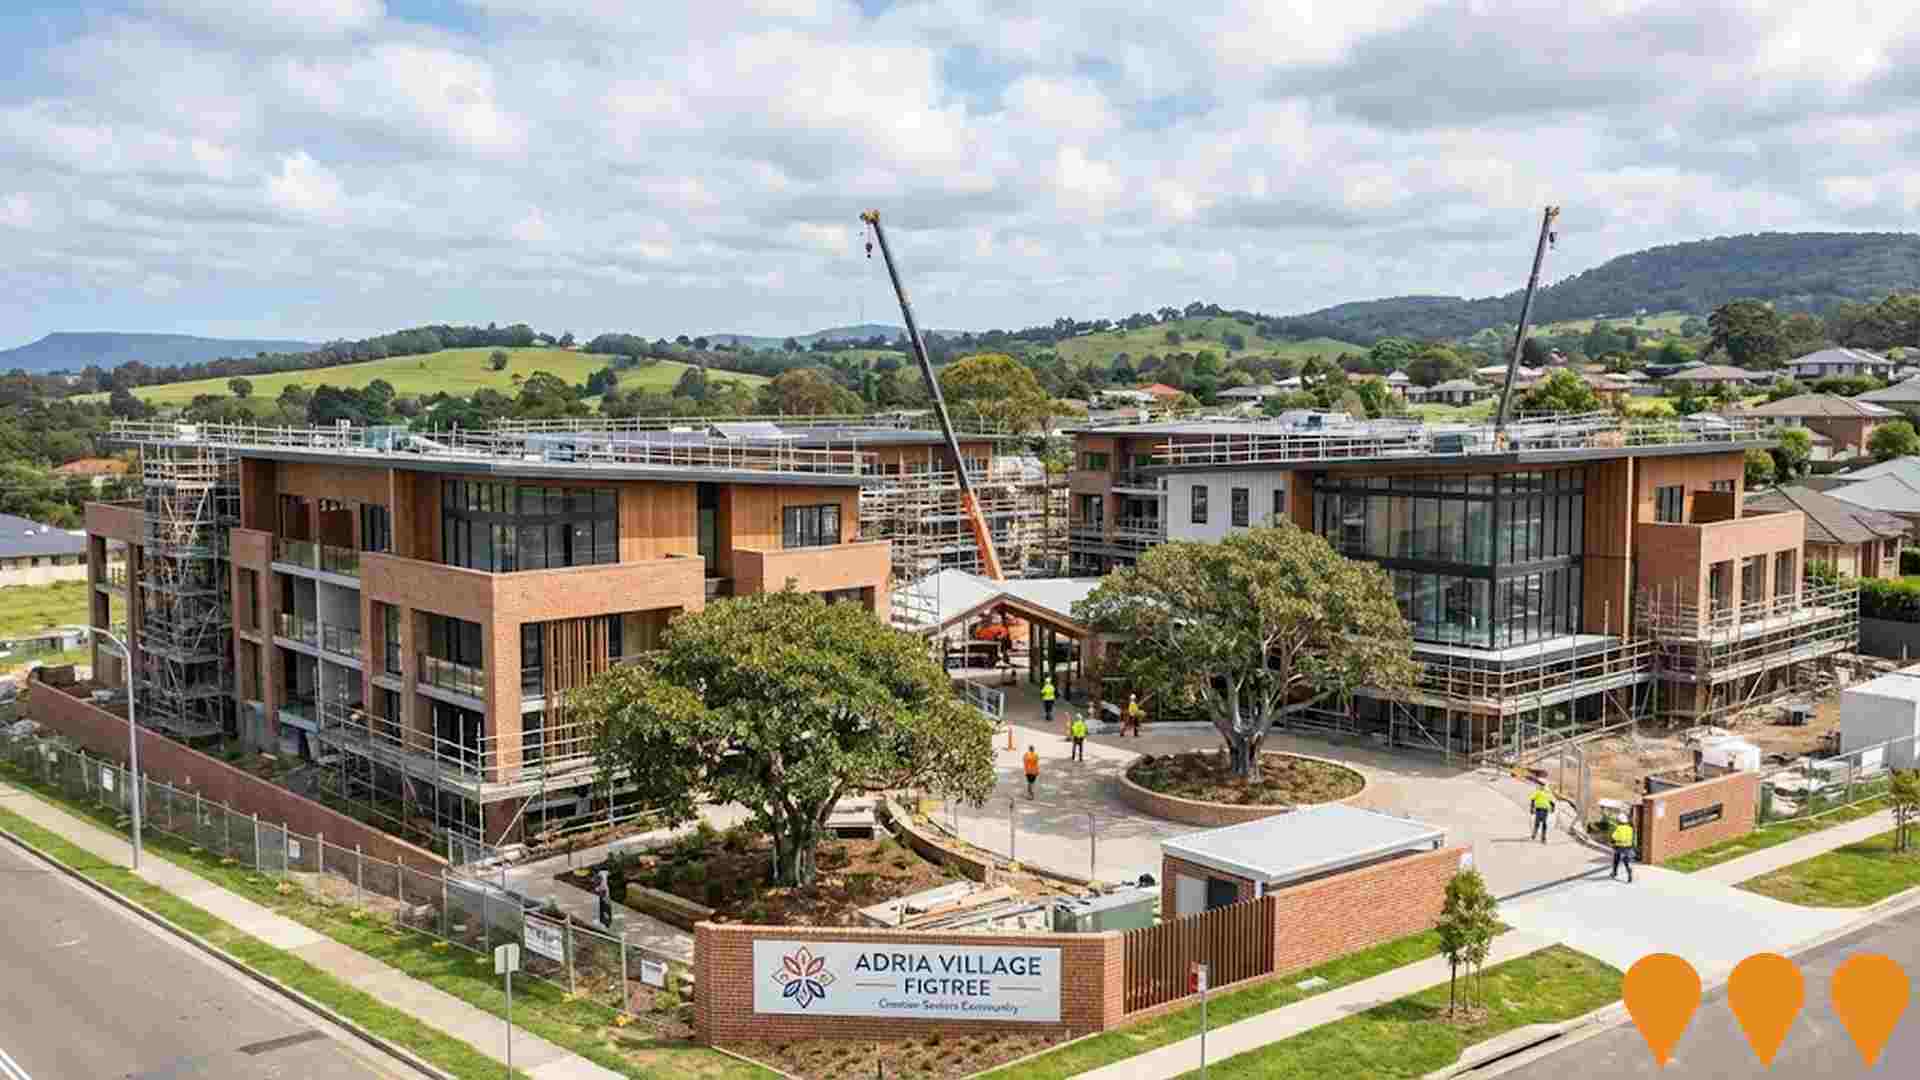
Adria Village Figtree
A $50 million Croatian-community focused seniors living precinct featuring a 102-bed residential aged care facility and 22 independent living units. Approved by the Land & Environment Court in May 2025 following redesign to resolve flooding and bulk/scale concerns. Site preparation and early works commenced in September 2025 with main construction now underway.
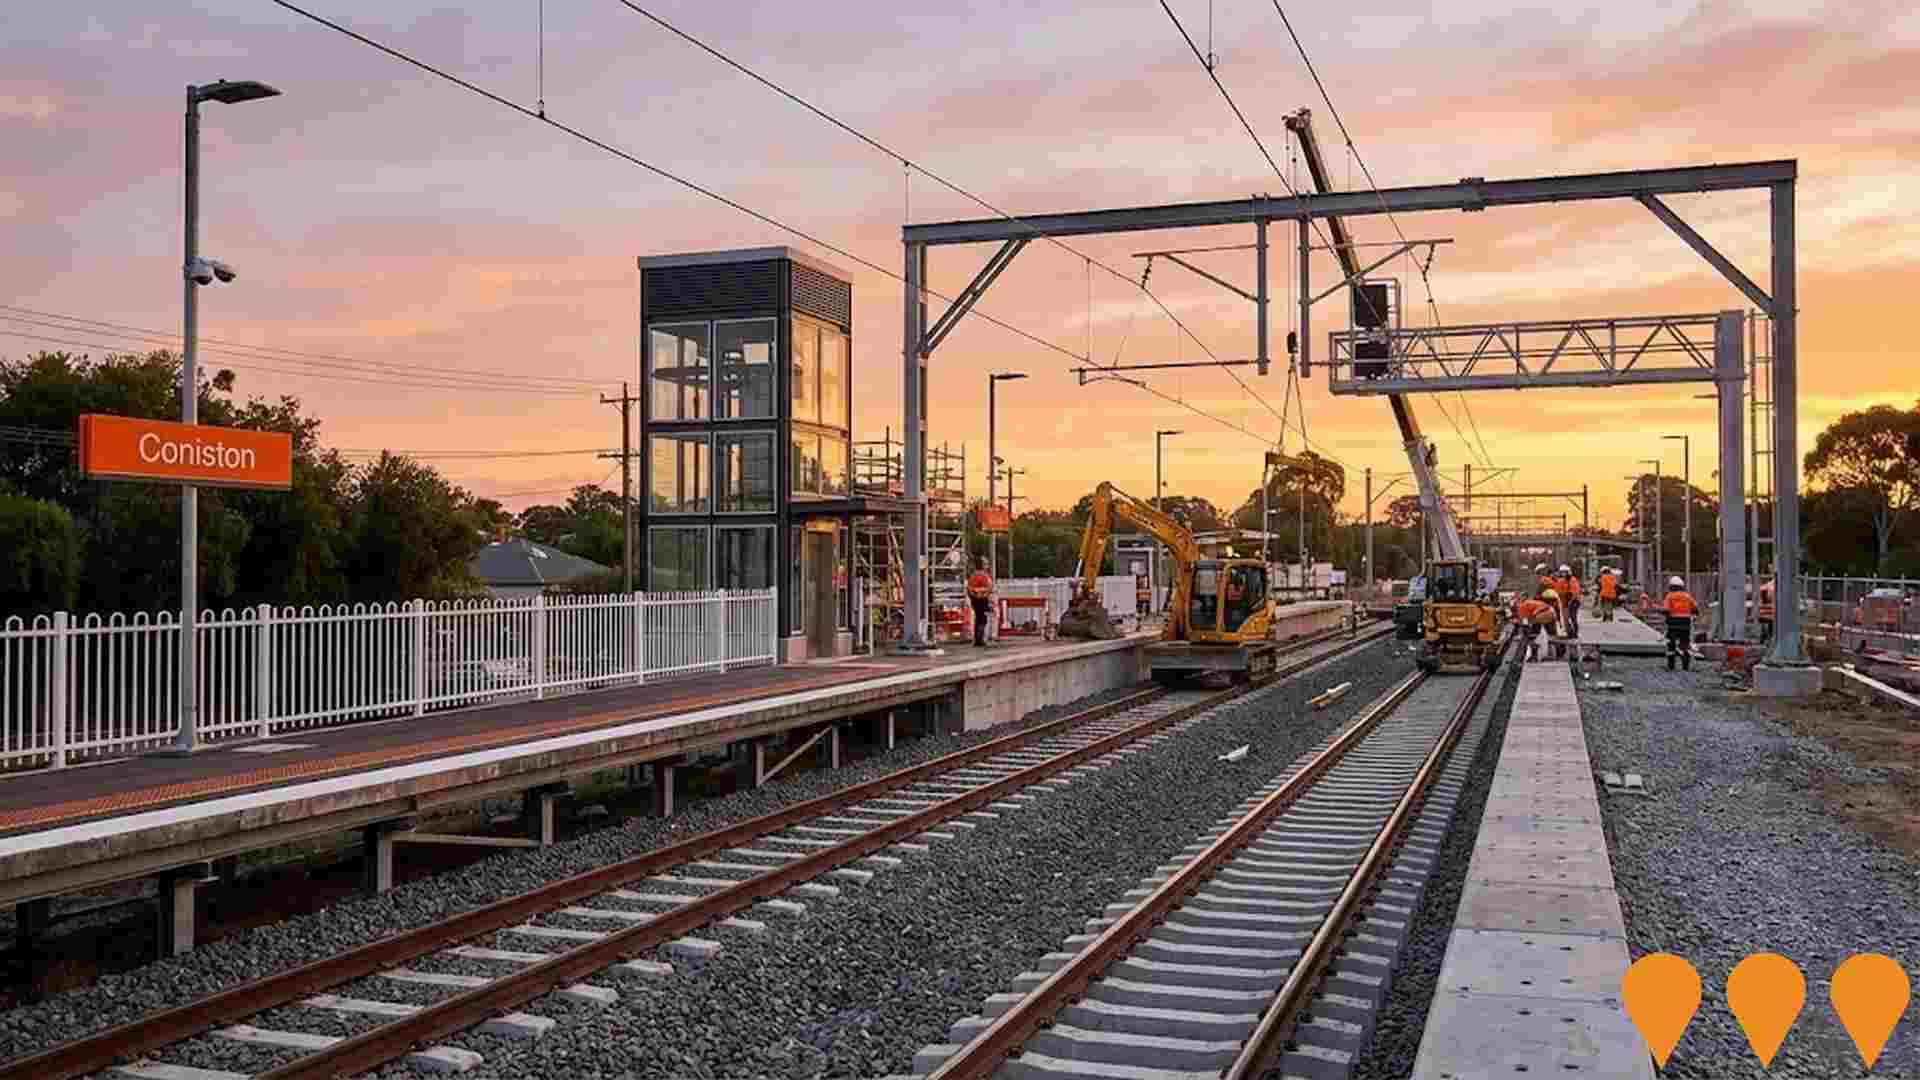
Wollongong to Coniston Rail Infrastructure Upgrade
The project involves duplicating approximately 3.5 km of track between Wollongong and Coniston, upgrading Wollongong and Coniston stations (new platforms, lifts, and accessibility improvements), new signalling, and associated infrastructure to allow more frequent and reliable train services on the South Coast Line.
Wollongong Station Master Plan
The Wollongong Station Master Plan is a Transport for NSW initiative to transform Wollongong Railway Station into a modern integrated transport hub. The project includes a new transport interchange, upgraded station facilities, improved pedestrian and cyclist access, commercial and retail opportunities, and enhanced public domain to support urban renewal in the Wollongong city centre.

Wollongong Health Precinct Strategy
Place-based strategy to guide future development of the Wollongong Health Precinct west of Wollongong CBD. Includes expansion of health facilities, affordable housing for key workers, and improved transport links.
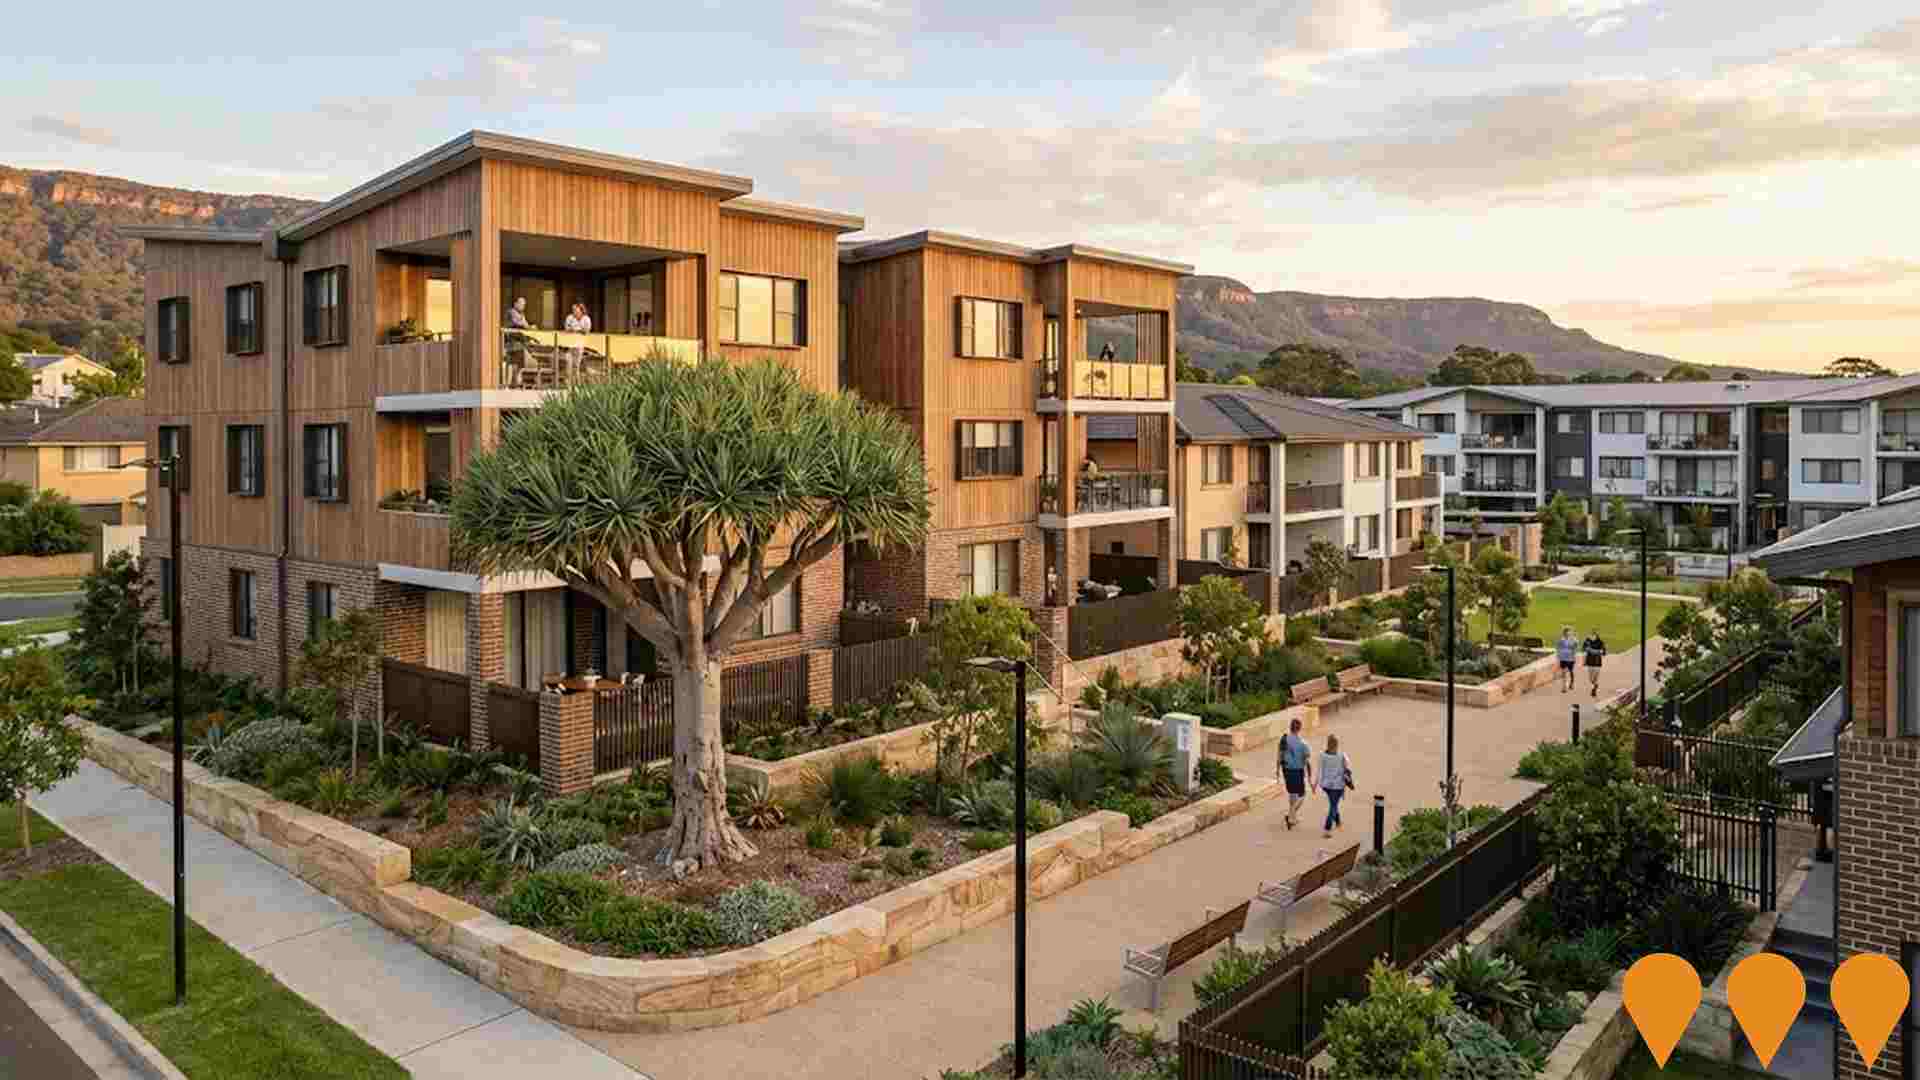
Gwynneville Renewal Project
Major urban renewal project to transform the Gwynneville precinct into a high-density residential area with up to 1,250 homes. The project will deliver 625 social and affordable dwellings (50%) and 625 market housing dwellings, including diverse housing types for seniors, students, and key workers. The Planning Proposal seeks to rezone most of the precinct from R2 Low Density Residential to R4 High Density Residential, with buildings ranging from 3-6 storeys. Public exhibition concluded May 5, 2025, following Gateway determination issued January 12, 2025. This long-term staged development will increase zoned open space from 0.83ha to 1.39ha and create 27 key development sites across the 131-lot precinct.
Employment
AreaSearch assessment indicates Wollongong - West faces employment challenges relative to the majority of Australian markets
Wollongong - West has a well-educated workforce with essential services sectors being well represented. The unemployment rate in the area was 7.2% as of June 2021.
Over the past year, there was an estimated employment growth of 0.7%. As of June 2025, 9,190 residents are employed while the unemployment rate is 3.6% higher than the Rest of NSW's rate of 3.7%. Workforce participation in Wollongong - West is at 60.9%, compared to the Rest of NSW's 56.4%.
The leading employment industries among residents include health care & social assistance, education & training, and retail trade. Conversely, agriculture, forestry & fishing shows lower representation at 0.3% versus the regional average of 5.3%. An analysis of SALM and ABS data over the 12 months to June 2025 shows employment increased by 0.7%, labour force increased by 0.5%, resulting in a decrease in unemployment by 0.1 percentage points. In comparison, Rest of NSW recorded an employment decline of 0.1%, labour force growth of 0.3%, with unemployment rising by 0.4 percentage points. State-level data to Nov-25 shows NSW employment contracted by 0.03% (losing 2,260 jobs), with the state unemployment rate at 3.9%. National employment forecasts from May-25 project national employment to expand by 6.6% over five years and 14.7% over ten years. Applying these projections to Wollongong - West's employment mix suggests local employment should increase by 6.9% over five years and 14.4% over ten years.
Frequently Asked Questions - Employment
Income
Income levels sit below national averages according to AreaSearch assessment
AreaSearch's latest postcode level ATO data for financial year 2022 shows that Wollongong - West SA2 has an income below the national average. The median income is $45,231 and the average income stands at $61,814. This contrasts with Rest of NSW's figures where the median income is $49,459 and the average income is $62,998. Based on Wage Price Index growth of 12.61% since financial year 2022, current estimates for Wollongong - West SA2 would be approximately $50,935 (median) and $69,609 (average) as of September 2025. According to the 2021 Census figures, household, family and personal incomes in Wollongong - West rank modestly, between the 39th and 41st percentiles. The largest income bracket comprises 31.0% earning $1,500 - 2,999 weekly (5,401 residents), aligning with the surrounding region where this cohort likewise represents 29.9%. Housing affordability pressures are severe in Wollongong - West, with only 81.2% of income remaining, ranking at the 39th percentile. The area's SEIFA income ranking places it in the 6th decile.
Frequently Asked Questions - Income
Housing
Wollongong - West displays a diverse mix of dwelling types, with a higher proportion of rental properties than the broader region
In Wollongong - West, as per the latest Census evaluation, 47.8% of dwellings were houses, with 52.2% being semi-detached, apartments, or 'other' dwellings. This compares to Non-Metro NSW's 58.9% houses and 41.1% other dwellings. Home ownership in Wollongong - West stood at 26.7%, with mortgaged dwellings at 25.6% and rented ones at 47.7%. The median monthly mortgage repayment was $2,000, below Non-Metro NSW's average of $2,189. Median weekly rent in Wollongong - West was $380, compared to Non-Metro NSW's $400. Nationally, Wollongong - West's mortgage repayments exceeded the Australian average of $1,863, while rents were higher than the national figure of $375.
Frequently Asked Questions - Housing
Household Composition
Wollongong - West features high concentrations of group households, with a lower-than-average median household size
Family households constitute 59.6% of all households, including 24.4% couples with children, 23.9% couples without children, and 9.8% single parent families. Non-family households comprise the remaining 40.4%, with lone person households at 29.8% and group households making up 10.6%. The median household size is 2.4 people, which is smaller than the Rest of NSW average of 2.5.
Frequently Asked Questions - Households
Local Schools & Education
The educational profile of Wollongong - West exceeds national averages, with above-average qualification levels and academic performance metrics
Educational attainment in Wollongong - West significantly surpasses broader benchmarks. As of the latest data, 36.9% of residents aged 15 years and over hold university qualifications, compared to 21.3% in the Rest of NSW and 25.2% in the SA4 region. This substantial educational advantage positions the area strongly for knowledge-based opportunities. Bachelor degrees lead at 23.4%, followed by postgraduate qualifications (10.8%) and graduate diplomas (2.7%).
Trade and technical skills feature prominently, with 29.8% of residents aged 15 years and over holding vocational credentials – advanced diplomas (9.7%) and certificates (20.1%). Educational participation is notably high, with 34.0% of residents currently enrolled in formal education. This includes 13.0% in tertiary education, 7.4% in primary education, and 6.1% pursuing secondary education.
Frequently Asked Questions - Education
Schools Detail
Nearby Services & Amenities
Transport
Transport servicing is high compared to other areas nationally based on assessment of service frequency, route connectivity and accessibility
Wollongong - West has 127 active public transport stops. These include both train and bus services. There are 61 individual routes operating in total, providing 5,441 weekly passenger trips collectively.
Residents have excellent accessibility to these stops, with an average distance of 139 meters to the nearest one. Across all routes, service frequency averages 777 trips per day, equating to approximately 42 weekly trips per stop.
Frequently Asked Questions - Transport
Transport Stops Detail
Health
Wollongong - West's residents are healthier than average in comparison to broader Australia with a fairly standard level of common health conditions seen across both young and old age cohorts
Wollongong - West residents show relatively positive health outcomes, with common conditions seen across both young and old age groups. Private health cover stands at approximately 51% (~8,816 people), lower than the 56.6% across Rest of NSW.
Mental health issues impact 10.2%, while arthritis affects 7.2%. About 69.5% declare no medical ailments, compared to 68.6% in Rest of NSW. Residents aged 65 and over comprise 13.6% (2,369 people), lower than the 17.7% in Rest of NSW. Overall health profile is broadly similar to general population.
Frequently Asked Questions - Health
Cultural Diversity
Wollongong - West was found to be more culturally diverse than the vast majority of local markets in Australia, upon assessment of a range of language and cultural background related metrics
Wollongong-West had a higher cultural diversity than most local areas, with 32.4% of its population born overseas and 30.2% speaking a language other than English at home. Christianity was the dominant religion in Wollongong-West, comprising 49.2% of the population. Islam was notably overrepresented, making up 4.6% compared to the regional average of 2.5%.
The top three ancestry groups were English (22.0%), Australian (21.0%), and Other (12.3%). There were significant differences in the representation of certain ethnic groups: Macedonian was at 4.2% versus 1.5% regionally, Serbian at 2.2% versus 0.8%, and Croatian at 1.0% versus 0.7%.
Frequently Asked Questions - Diversity
Age
Wollongong - West hosts a young demographic, positioning it in the bottom quartile nationwide
The median age in Wollongong-West is 33 years, which is significantly lower than Rest of NSW's average of 43 and substantially under the national average of 38. The 25-34 cohort makes up 22.3% of the population in Wollongong-West, notably higher than Rest of NSW's average, while those aged 65-74 are under-represented at 7.0%. This concentration of the 25-34 age group is well above the national average of 14.5%. According to post-2021 Census data, the 25 to 34 age group has increased from 19.0% to 22.3%, while the 45 to 54 cohort has decreased from 11.7% to 10.2%. Population forecasts for 2041 indicate significant demographic changes in Wollongong-West, with the 25 to 34 age group projected to grow by 59% (adding 2,296 people), reaching a total of 6,184 from the current figure of 3,887.
