Chart Color Schemes
This analysis uses ABS Statistical Areas Level 2 (SA2) boundaries, which can materially differ from Suburbs and Localities (SAL) even when sharing similar names.
SA2 boundaries are defined by the Australian Bureau of Statistics and are designed to represent communities for statistical reporting (e.g., census and ERP).
Suburbs and Localities (SAL) represent commonly-used suburb/locality names (postal-style areas) and may use different geographic boundaries. For comprehensive analysis, consider reviewing both boundary types if available.
est. as @ -- *
ABS ERP | -- people | --
2021 Census | -- people
Sales Activity
Curious about local property values? Filter the chart to assess the volume and appreciation (including resales) trends and regional comparisons, or scroll to the map below view this information at an individual property level.
Find a Recent Sale
Sales Detail
Population
An assessment of population growth drivers in Mayfield - Warabrook reveals an overall ranking slightly below national averages considering recent, and medium term trends
As of November 2025, Mayfield-Warabrook's population is approximately 16,123, reflecting a 3.8% increase since the 2021 Census which reported a population of 15,526. This growth is inferred from an estimated resident population of 15,963 in June 2024 and an additional 298 validated new addresses since the Census date. The population density ratio is 2,138 persons per square kilometer, above the national average assessed by AreaSearch. Mayfield-Warabrook's growth rate of 3.8% positions it within 1.3 percentage points of non-metro areas (5.1%). Overseas migration was the primary driver of population growth in recent periods. AreaSearch adopts ABS/Geoscience Australia projections for each SA2 area, released in 2024 with a base year of 2022, and NSW State Government's SA2 level projections for areas not covered by this data, released in 2022 with a base year of 2021.
By 2041, Mayfield-Warabrook is expected to increase by approximately 2,117 persons, reflecting a total gain of 12.1% over the 17 years based on the latest annual ERP population numbers.
Frequently Asked Questions - Population
Development
Residential development activity is lower than average in Mayfield - Warabrook according to AreaSearch's national comparison of local real estate markets
Mayfield-Warabrook has recorded approximately 43 residential properties granted approval annually. Over the past five financial years, from FY21 to FY25, around 218 homes were approved, with a further 21 approved in FY26 as of the given date. On average, each dwelling constructed over these five years accommodated about 1.9 new residents per year. However, data shows this has increased to 6 people per dwelling over the past two financial years, indicating growing popularity and potential undersupply.
New homes are being built at an average construction cost value of $243,000, reflecting more affordable housing options compared to regional norms. In terms of commercial development, Mayfield-Warabrook has recorded around $84.5 million in approvals for this financial year, demonstrating high levels of local commercial activity. Compared to the rest of NSW, Mayfield-Warabrook has roughly half the rate of new dwelling approvals per person and places among the 23rd percentile nationally, suggesting limited housing choices for buyers and supporting demand for existing homes. The current development mix consists of approximately 45% detached dwellings and 55% medium to high-density housing. This shift from the current housing mix (76% houses) reflects reduced availability of development sites and addresses shifting lifestyle demands and affordability requirements. The location has around 673 people per dwelling approval, indicating an established market.
Future projections estimate Mayfield-Warabrook will add approximately 1,956 residents by 2041, based on the latest AreaSearch quarterly estimate. If current development rates continue, housing supply may struggle to match population growth, potentially heightening buyer competition and supporting price increases.
Frequently Asked Questions - Development
Infrastructure
Mayfield - Warabrook has strong levels of nearby infrastructure activity, ranking in the top 30% nationally
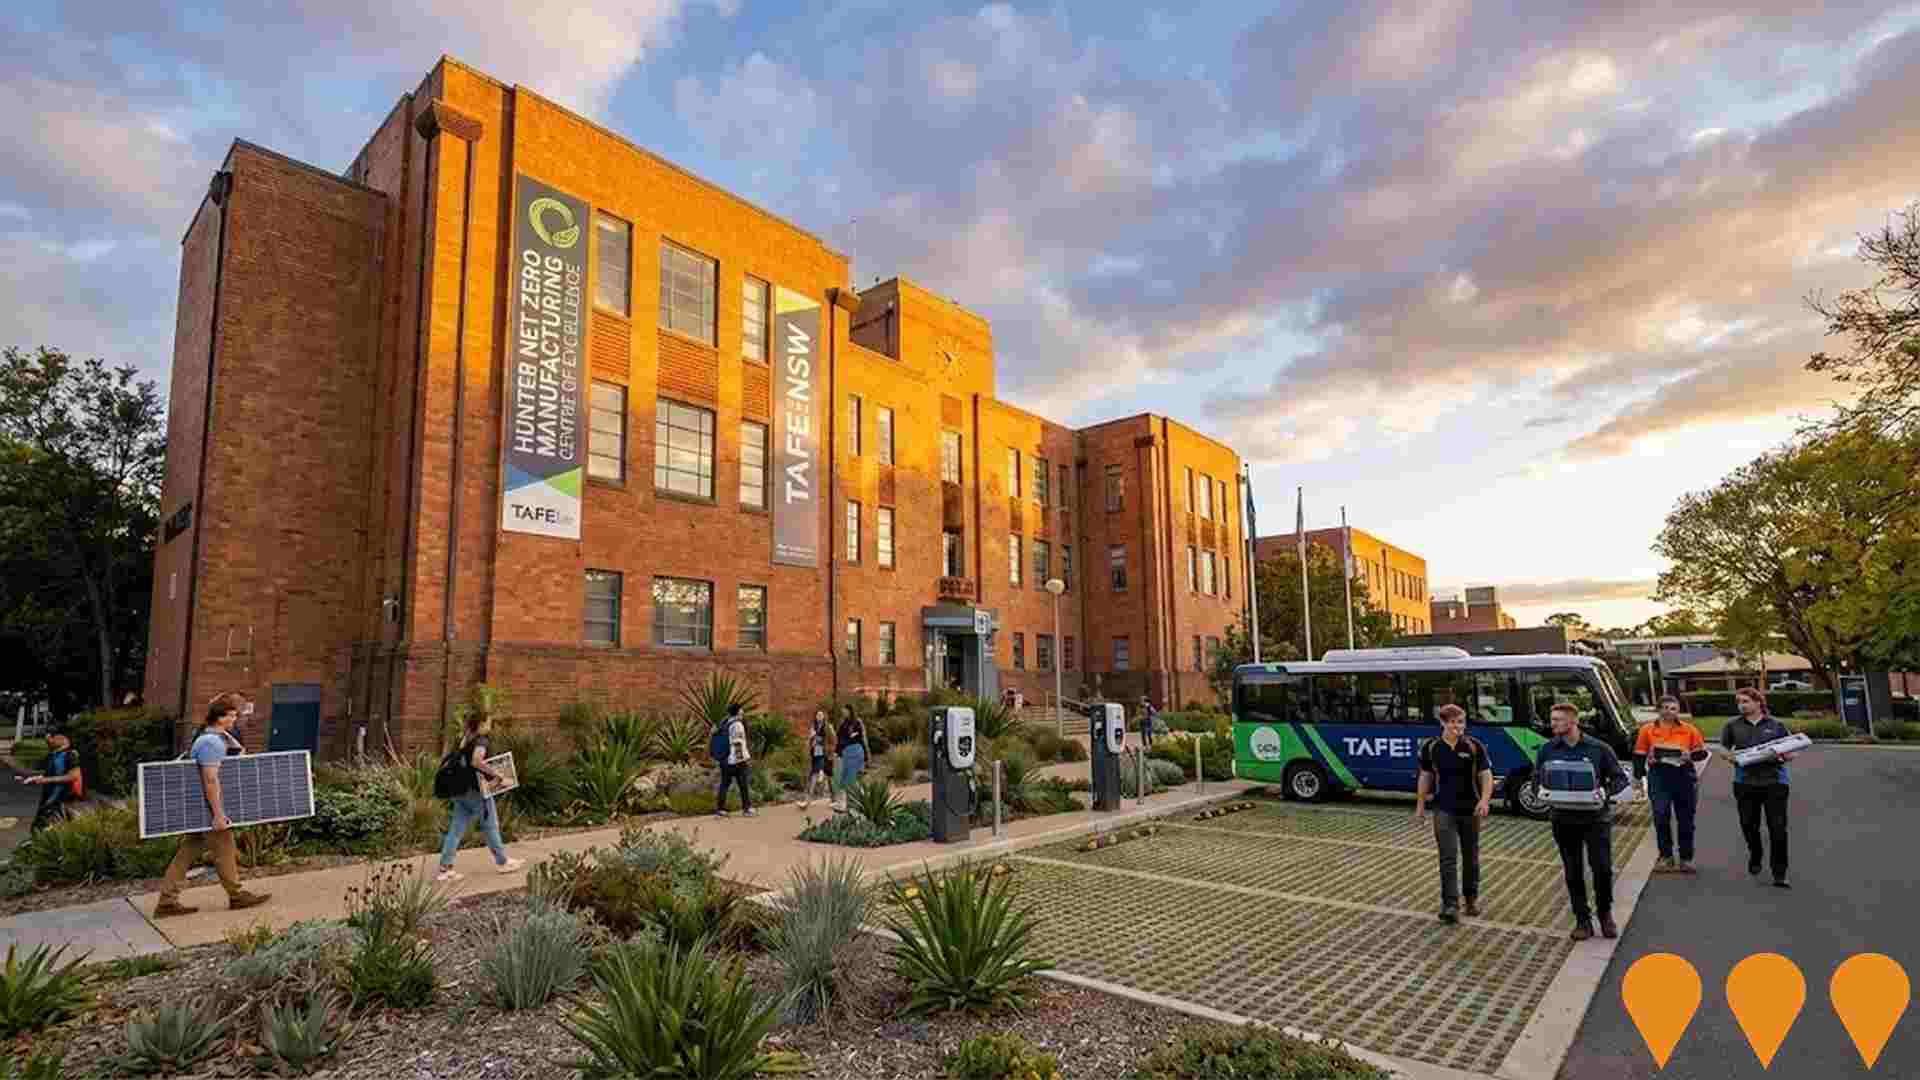
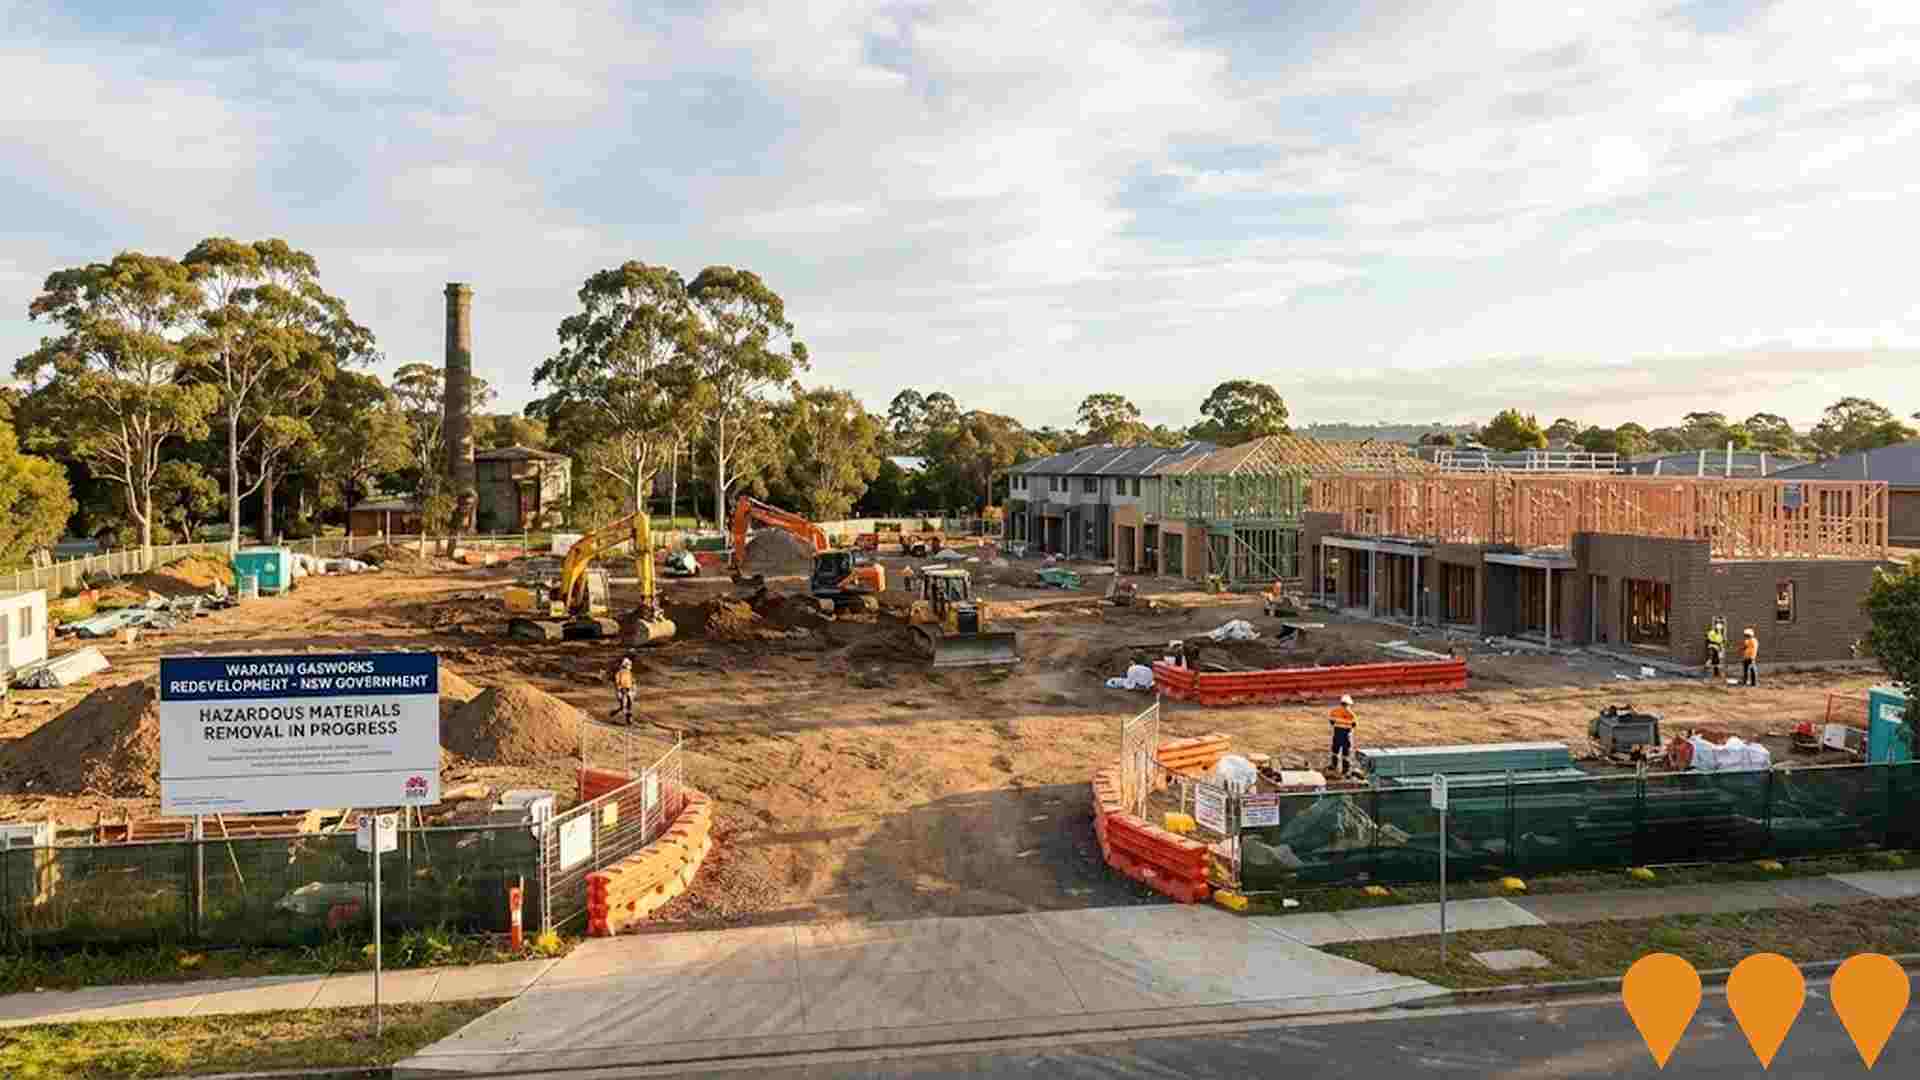
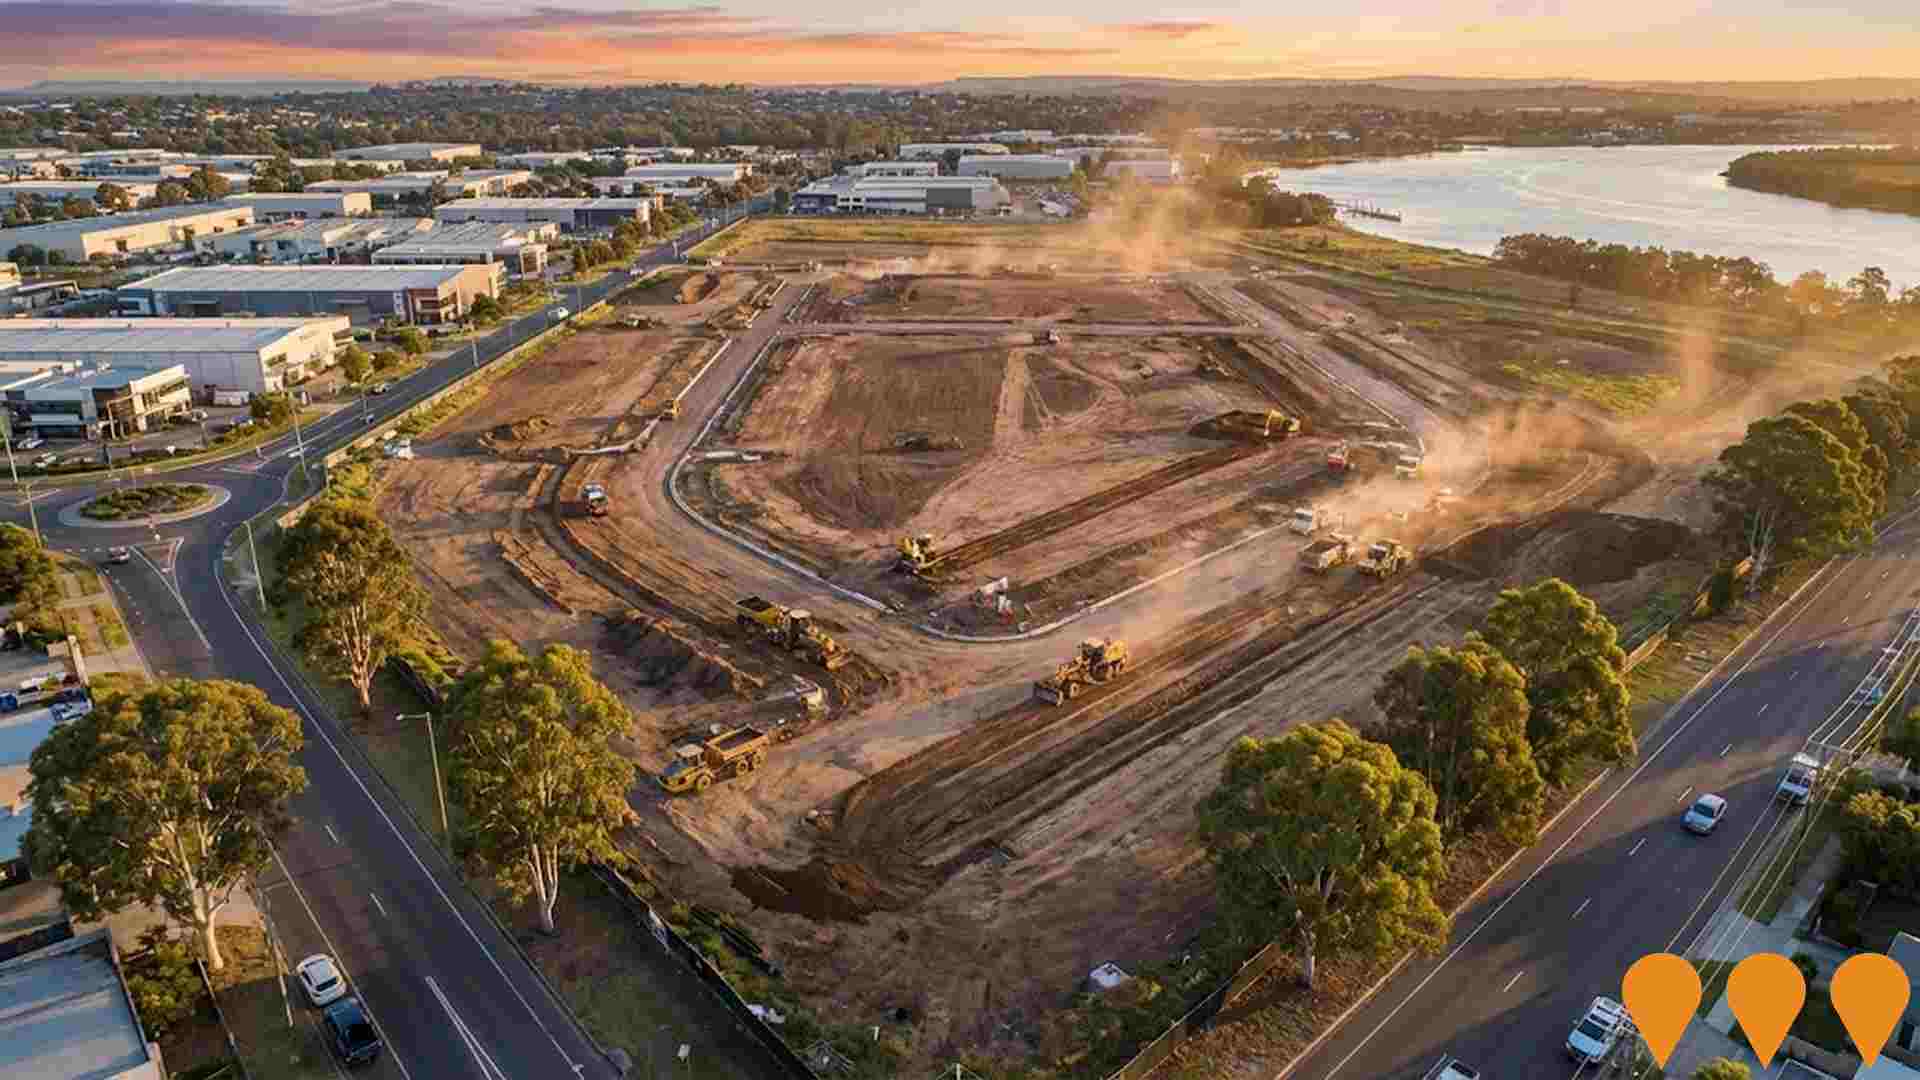
Changes in local infrastructure significantly affect an area's performance. AreaSearch has identified a total of 21 projects that may impact the area. Notable projects include Newcastle Port Logistics Hub, Mayfield Concept Plan, Subdivision at 110 Elizabeth Street, Tighes Hill, and Hunter Net Zero Manufacturing Centre of Excellence. The following list details those considered most relevant.
Professional plan users can use the search below to filter and access additional projects.
INFRASTRUCTURE SEARCH
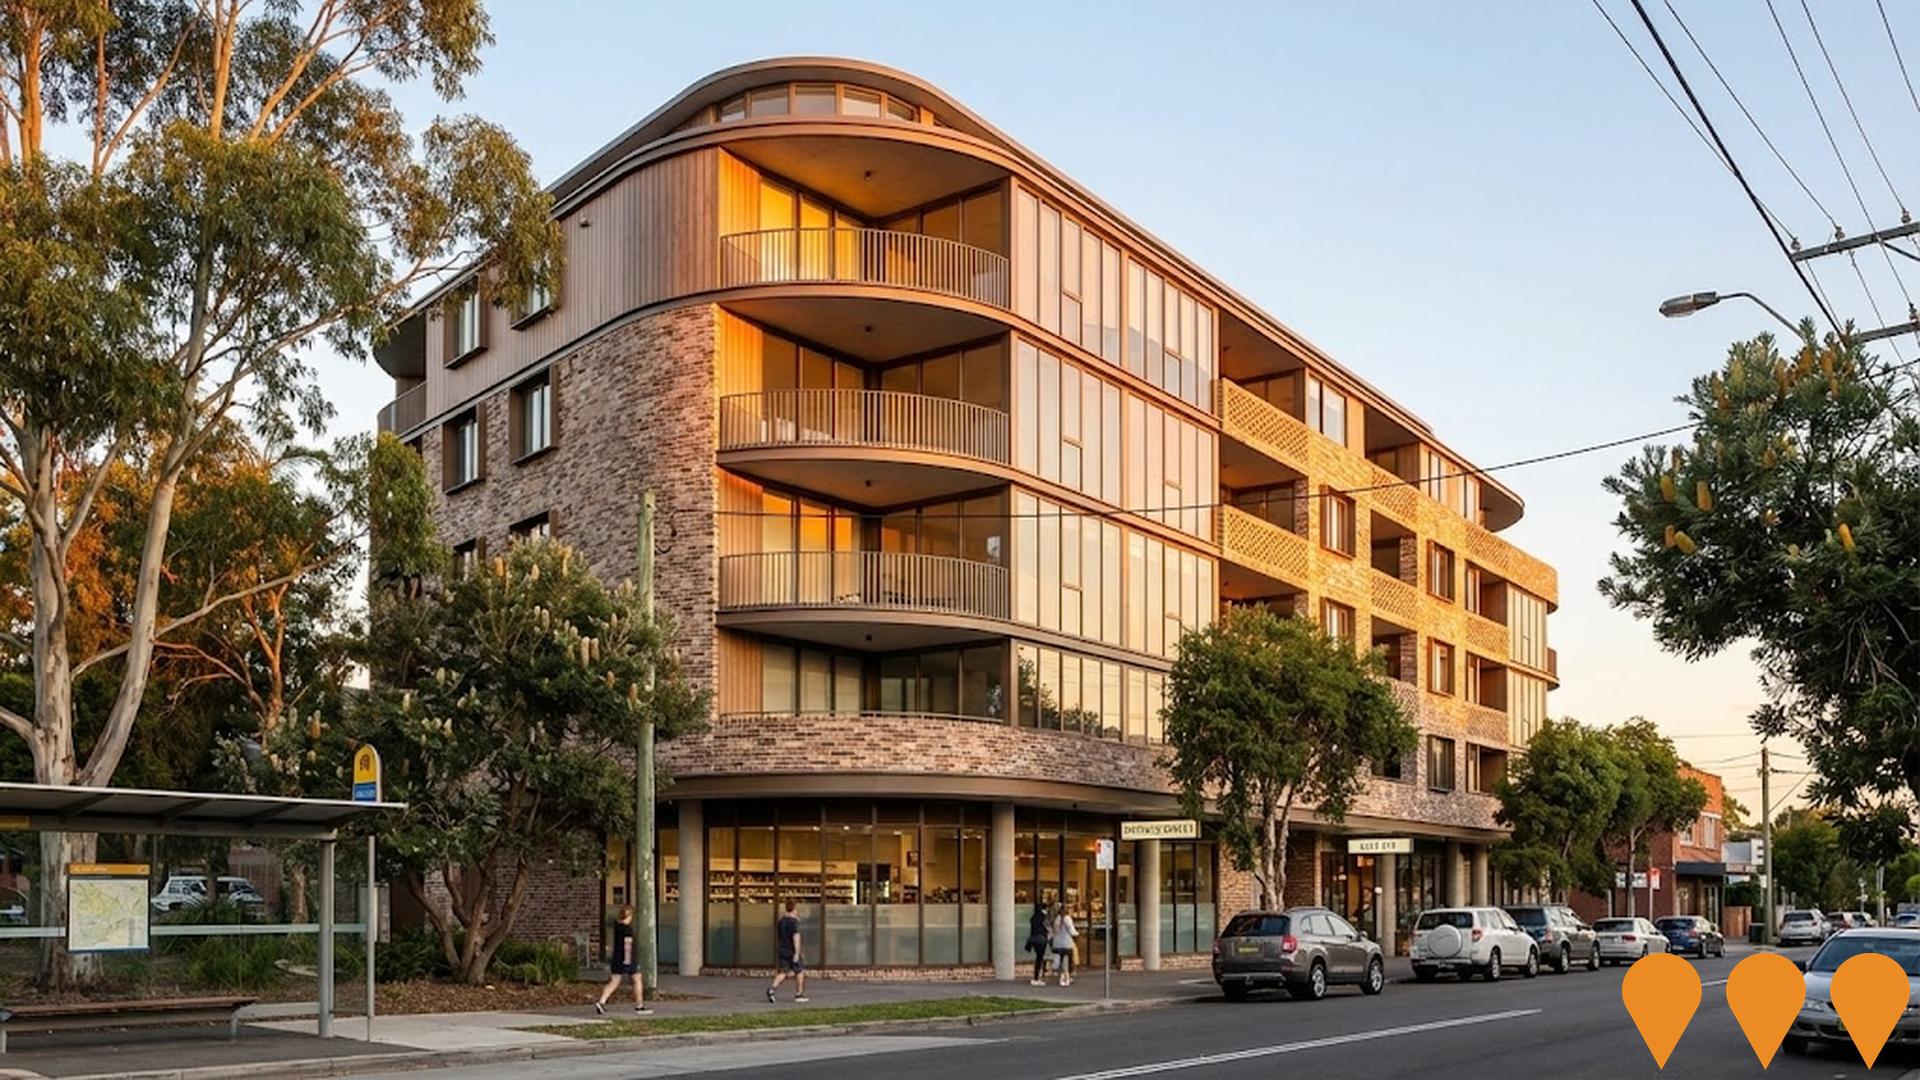
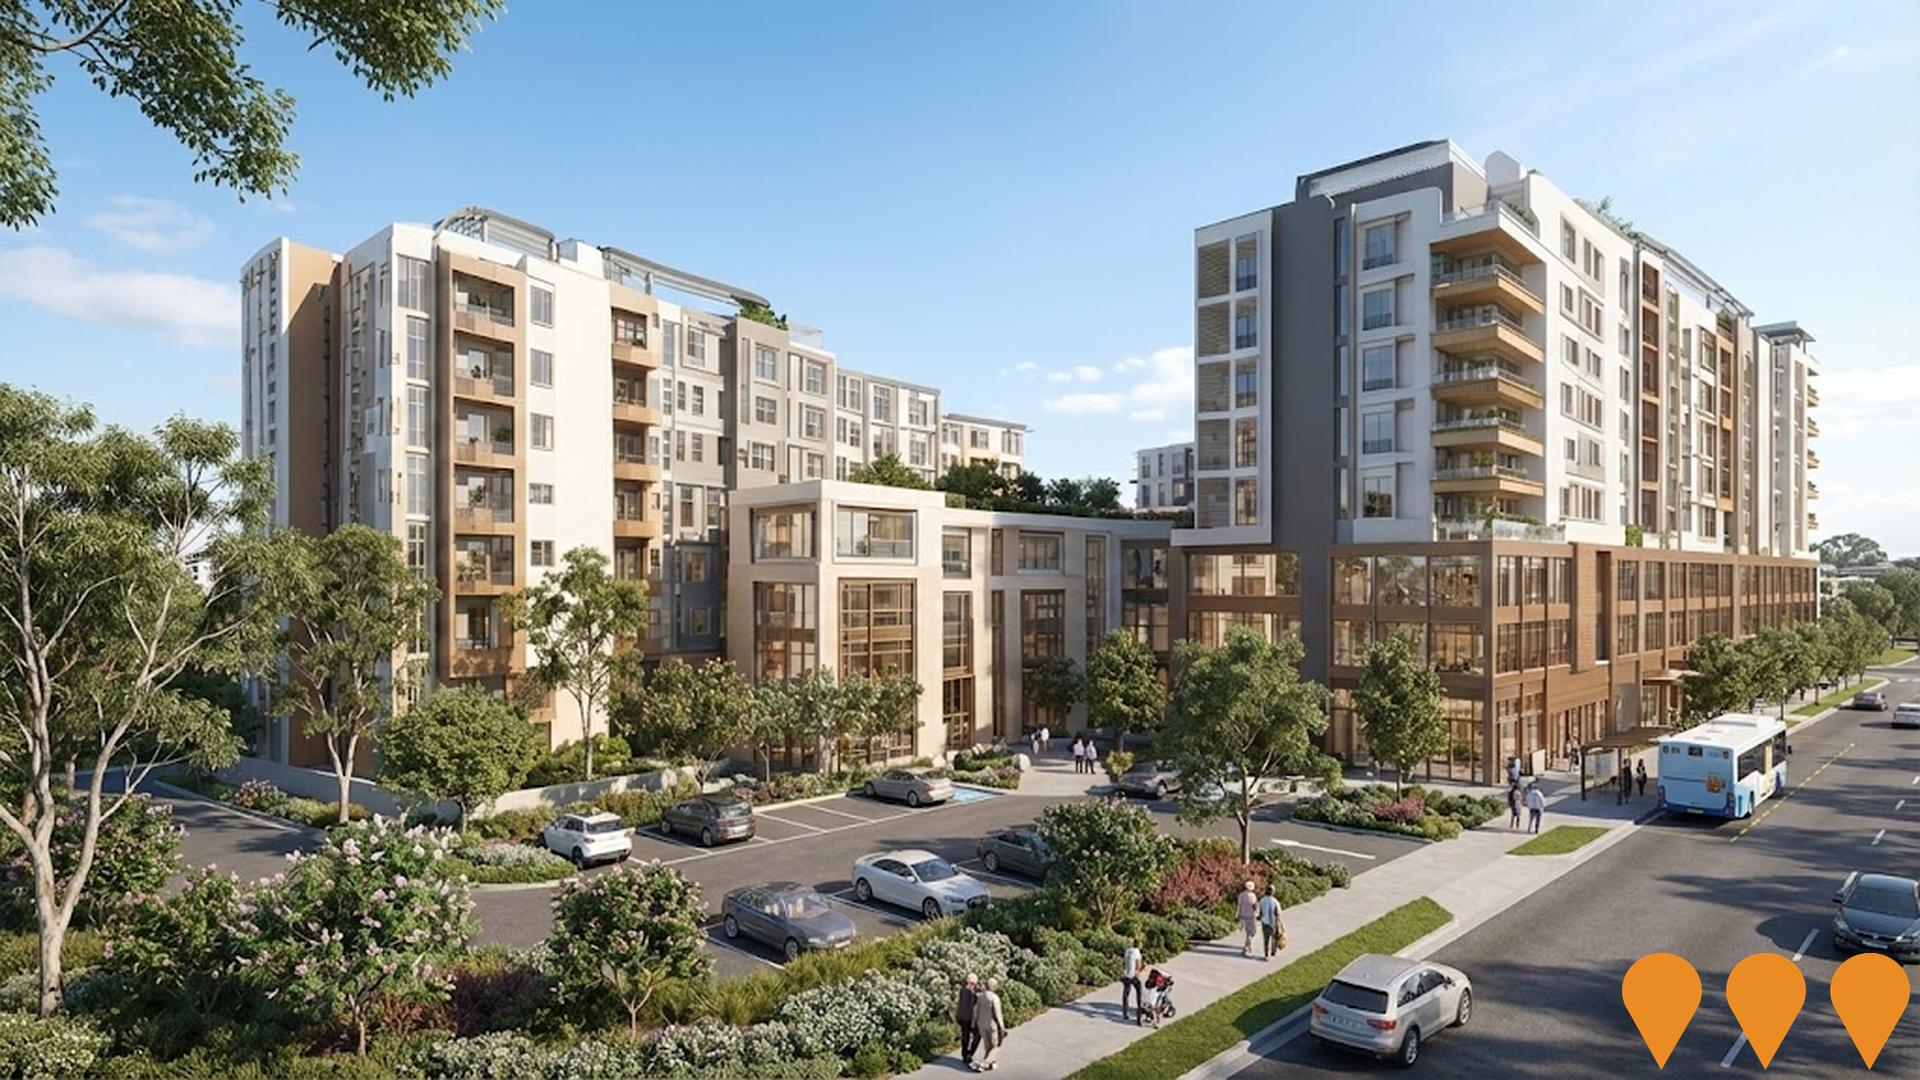
 Denotes AI-based impression for illustrative purposes only, not to be taken as definitive under any circumstances. Please follow links and conduct other investigations from the project's source for actual imagery. Developers and project owners wishing us to use original imagery please Contact Us and we will do so.
Frequently Asked Questions - Infrastructure
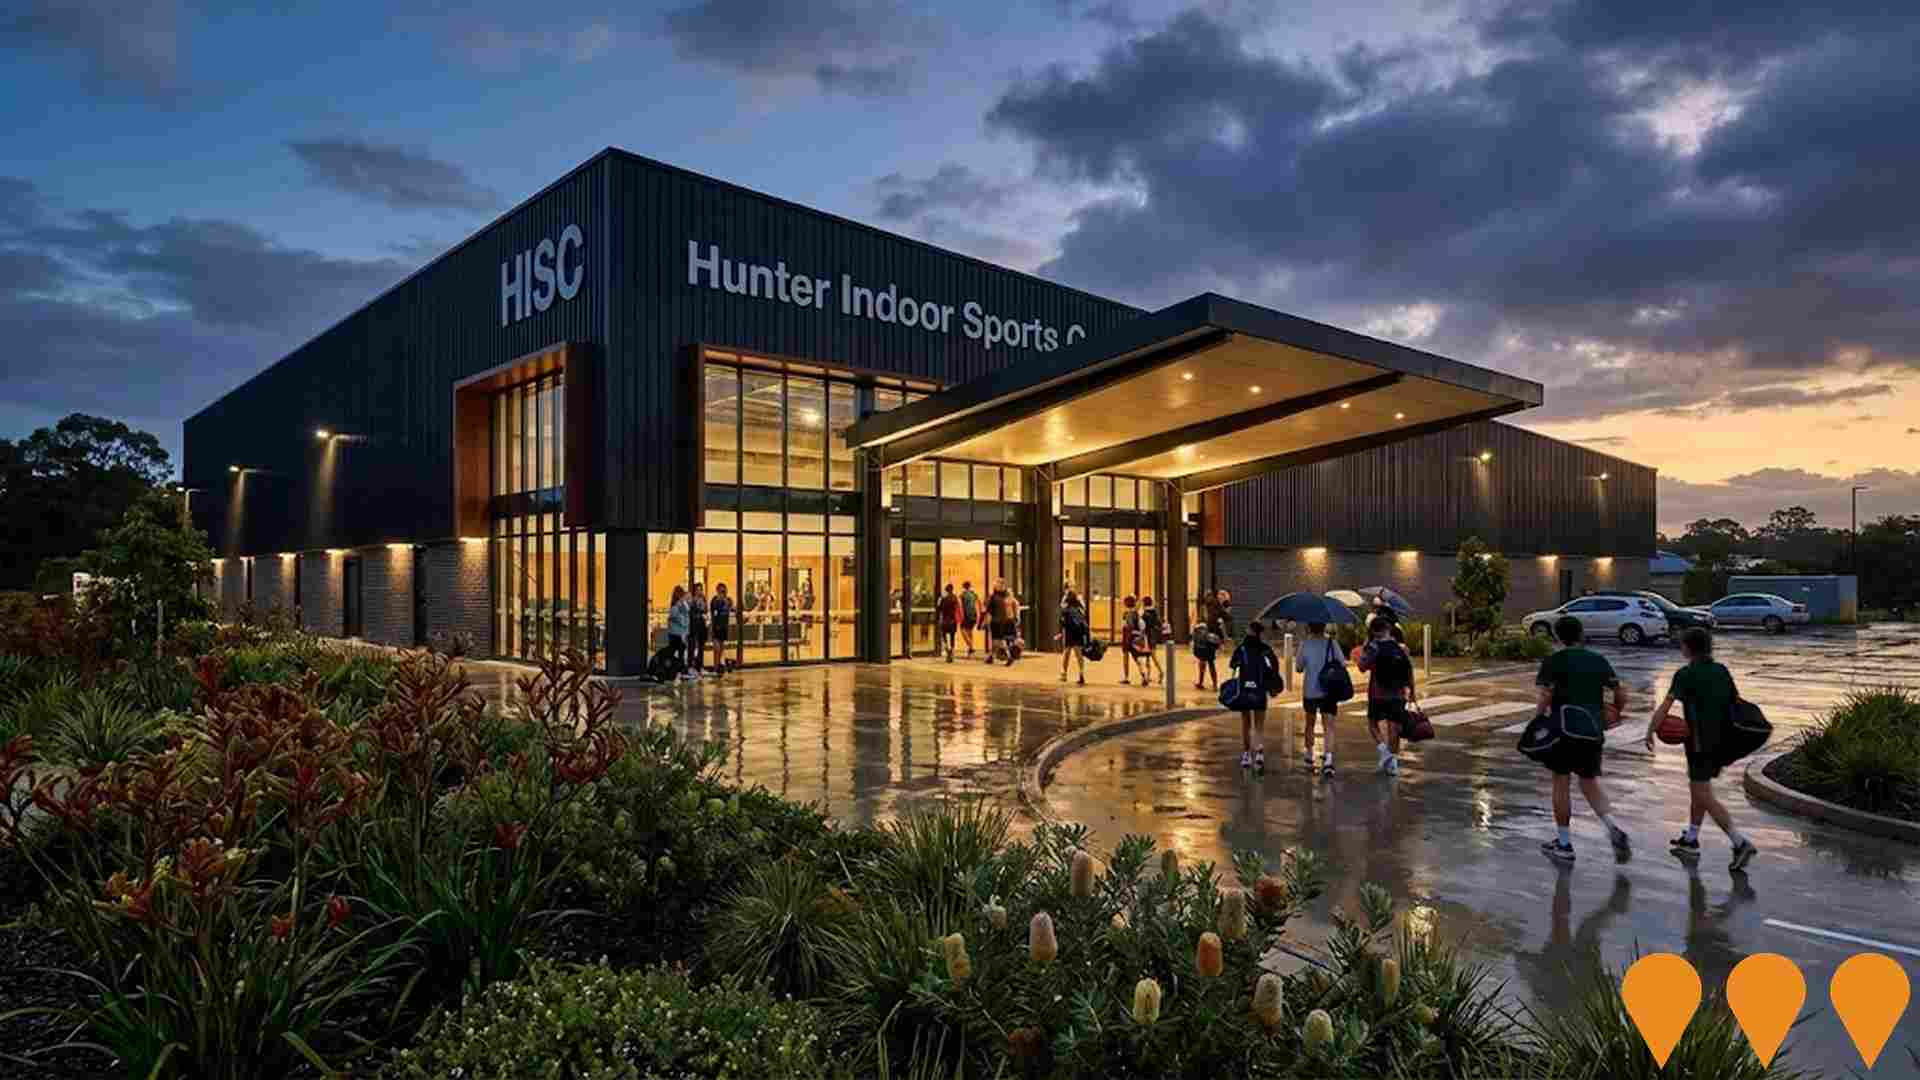
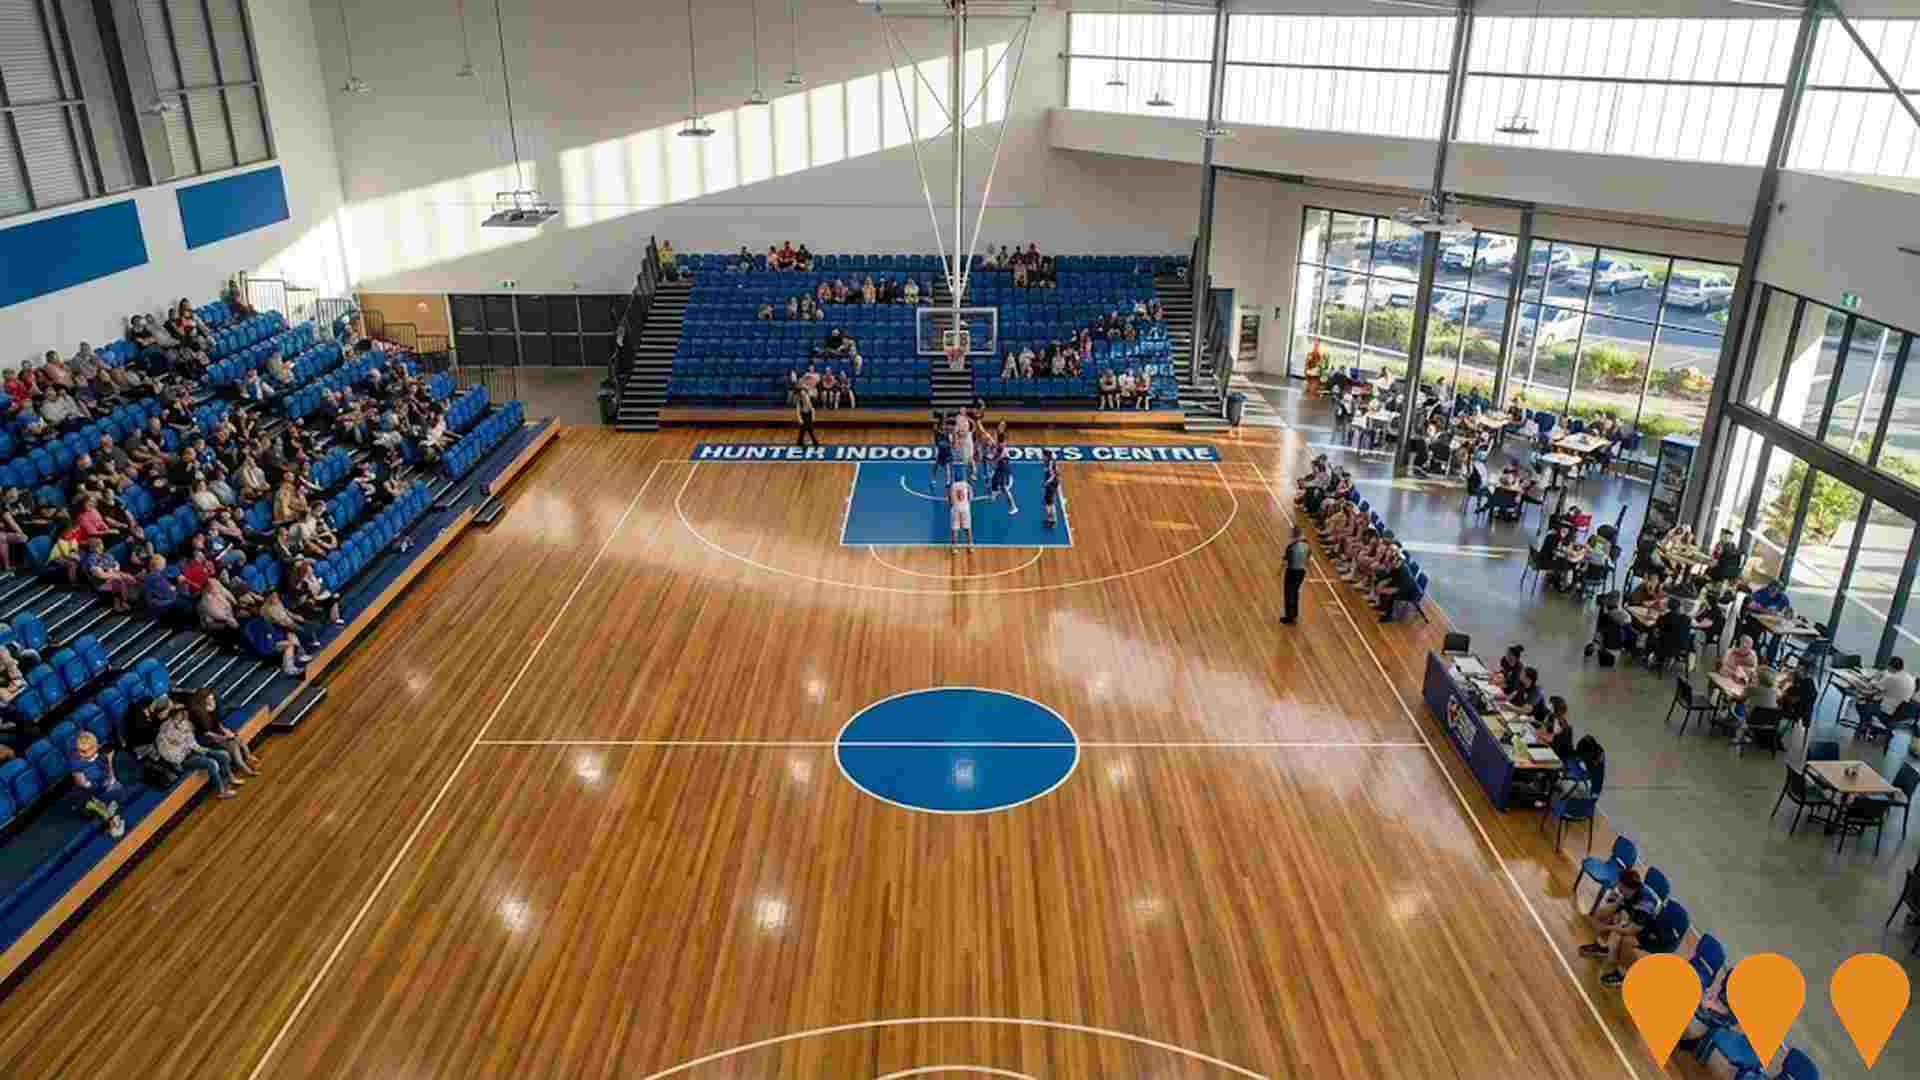
Hunter Indoor Sports Centre
A new 12-court indoor sports facility with a 2,500-seat show court, multi-purpose courts for basketball, netball, volleyball, futsal, pickleball, badminton and wheelchair sports, plus gym, health suites, cafe and extensive car parking. The centre will replace the ageing Newcastle Basketball Stadium and address the critical shortage of indoor sports venues in the Hunter region.
Newcastle Future Transit Corridor
Transport for NSW has confirmed the **Newcastle Future Transit Corridor** route, which will run between the Newcastle Interchange and the Broadmeadow precinct, primarily along Tudor Street. This corridor is being safeguarded to enable **future transport options**, such as light rail or rapid buses, supporting urban growth and projected housing and employment at Broadmeadow. The initial route segment closest to the Newcastle Interchange has been earmarked as the **Newcastle Future Infrastructure Corridor** to implement planning controls for its protection. A 2020 Strategic Business Case identified an extension from Newcastle Interchange to John Hunter Hospital via Broadmeadow as the most suitable long-term option, but noted bus solutions could precede light rail due to economic feasibility and to build patronage.

Newcastle Future Transit Corridor
A protected public transport corridor from Newcastle Interchange (Wickham) to the Broadmeadow precinct via Tudor and Belford streets. The corridor safeguards future rapid bus or light rail options, enhances walking and cycling connections, and supports the planned growth of Broadmeadow (up to 20,000 new homes and 15,000 new jobs). As of December 2025 the corridor alignment has been finalised, rezoning is progressing to legally protect the land, and detailed design, mode selection and construction timing remain subject to future funding and government decisions. Community consultation continues.
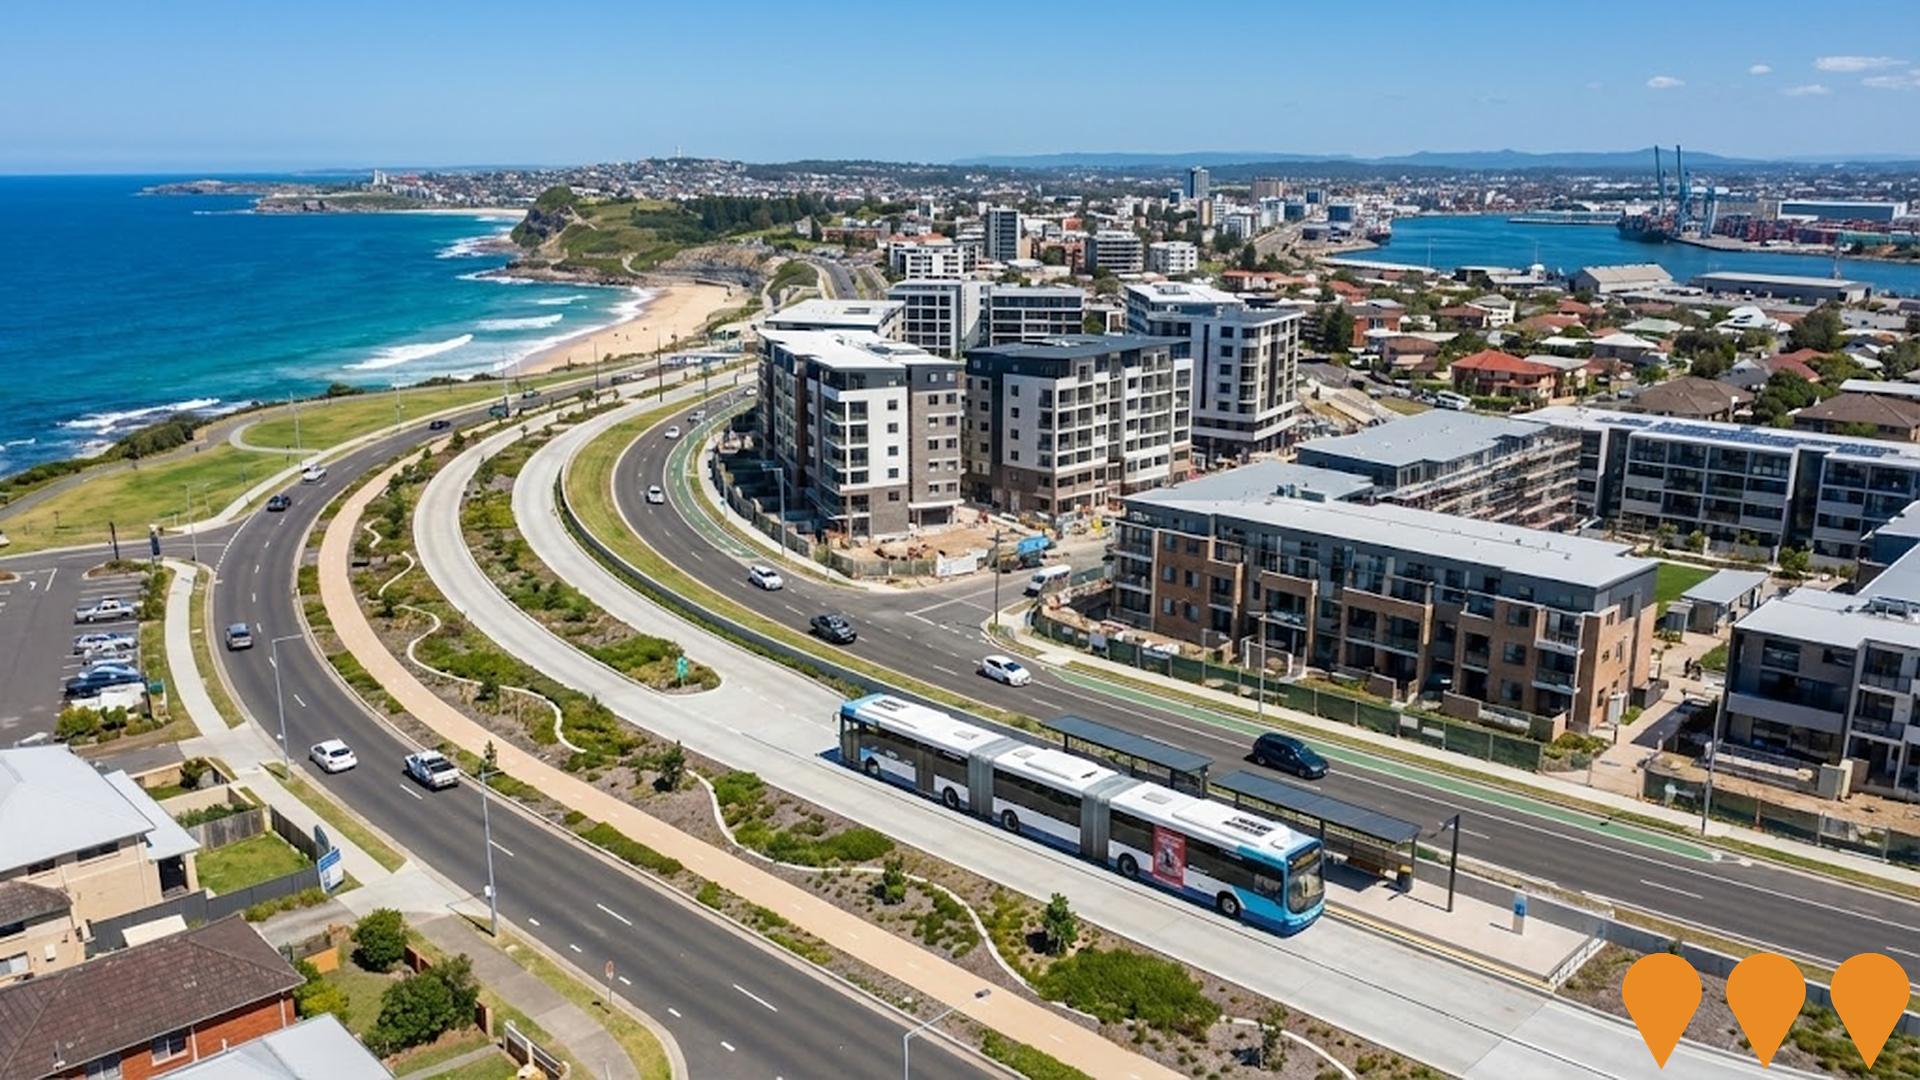
Transport Oriented Development Area - Hamilton Station
State-led planning reform allowing higher density residential development within 400 metres of Hamilton Station. The Transport Oriented Development planning controls commenced 13 May 2024, permitting residential flat buildings up to 22 metres (6 storeys) and shop top housing up to 24 metres with a maximum floor space ratio of 2.5:1. Development applications can now be lodged for residential flat buildings in residential and local centre zones, and shop top housing in commercial zones. All developments over 2,000 square metres gross floor area must include a mandatory 2% affordable housing contribution managed by registered community housing providers. Part of the broader NSW TOD Program aiming to deliver over 170,000 well-located homes near transport hubs across 37 stations over the next 15 years.

Newcastle Port Logistics Hub
A major distribution hub on 14.3 hectares at 51-71 Industrial Drive, Mayfield, providing purpose-built facilities for logistics, manufacturing, and agribusiness with excellent transport links. Construction has started on the $130 million first stage of the $225 million project.
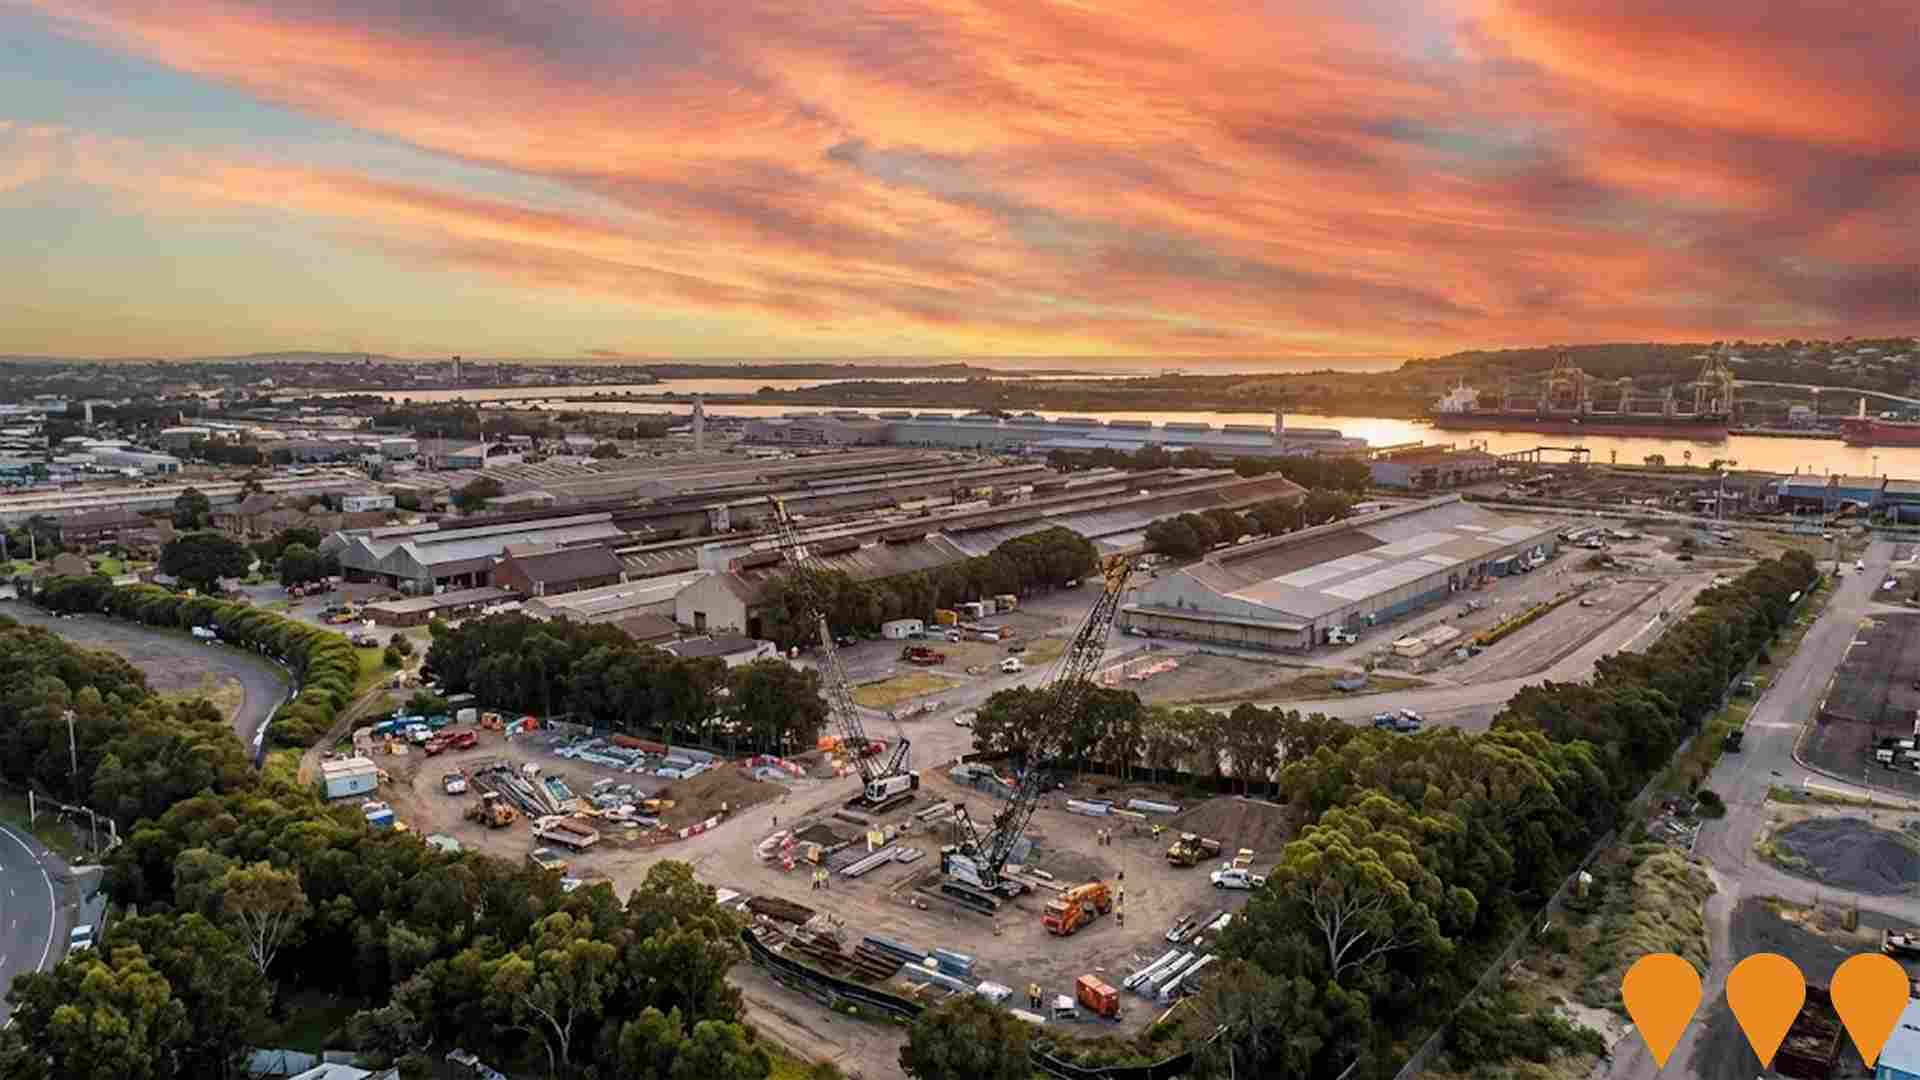
Mayfield Concept Plan
The Mayfield Concept Plan involves developing a 90-hectare port-side site for port-related activities, initially focusing on bulk liquids, with future opportunities for multi-purpose cargo facilities including a proposed $1.8 billion Multi-purpose Deepwater Terminal. Current operations include the Stolthaven Mayfield Terminal for bulk fuel storage, the Mayfield Cargo Storage Facility for various cargoes, and infrastructure upgrades such as the 2021-commissioned electrical substation. The plan aims to diversify the Hunter and NSW economies and improve supply chain efficiency. Adjacent state-owned Intertrade site is being developed by EnergyCo into a logistics precinct for renewable energy components storage and transport.

Hunter Park Precinct
$500 million mixed-use urban renewal project transforming 63 hectares around McDonald Jones Stadium into a sporting, entertainment, and lifestyle precinct. Includes 2,600 new homes, 50 hectares of public open space, state-of-the-art sporting facilities, entertainment venues, and 13,000sqm of commercial space.
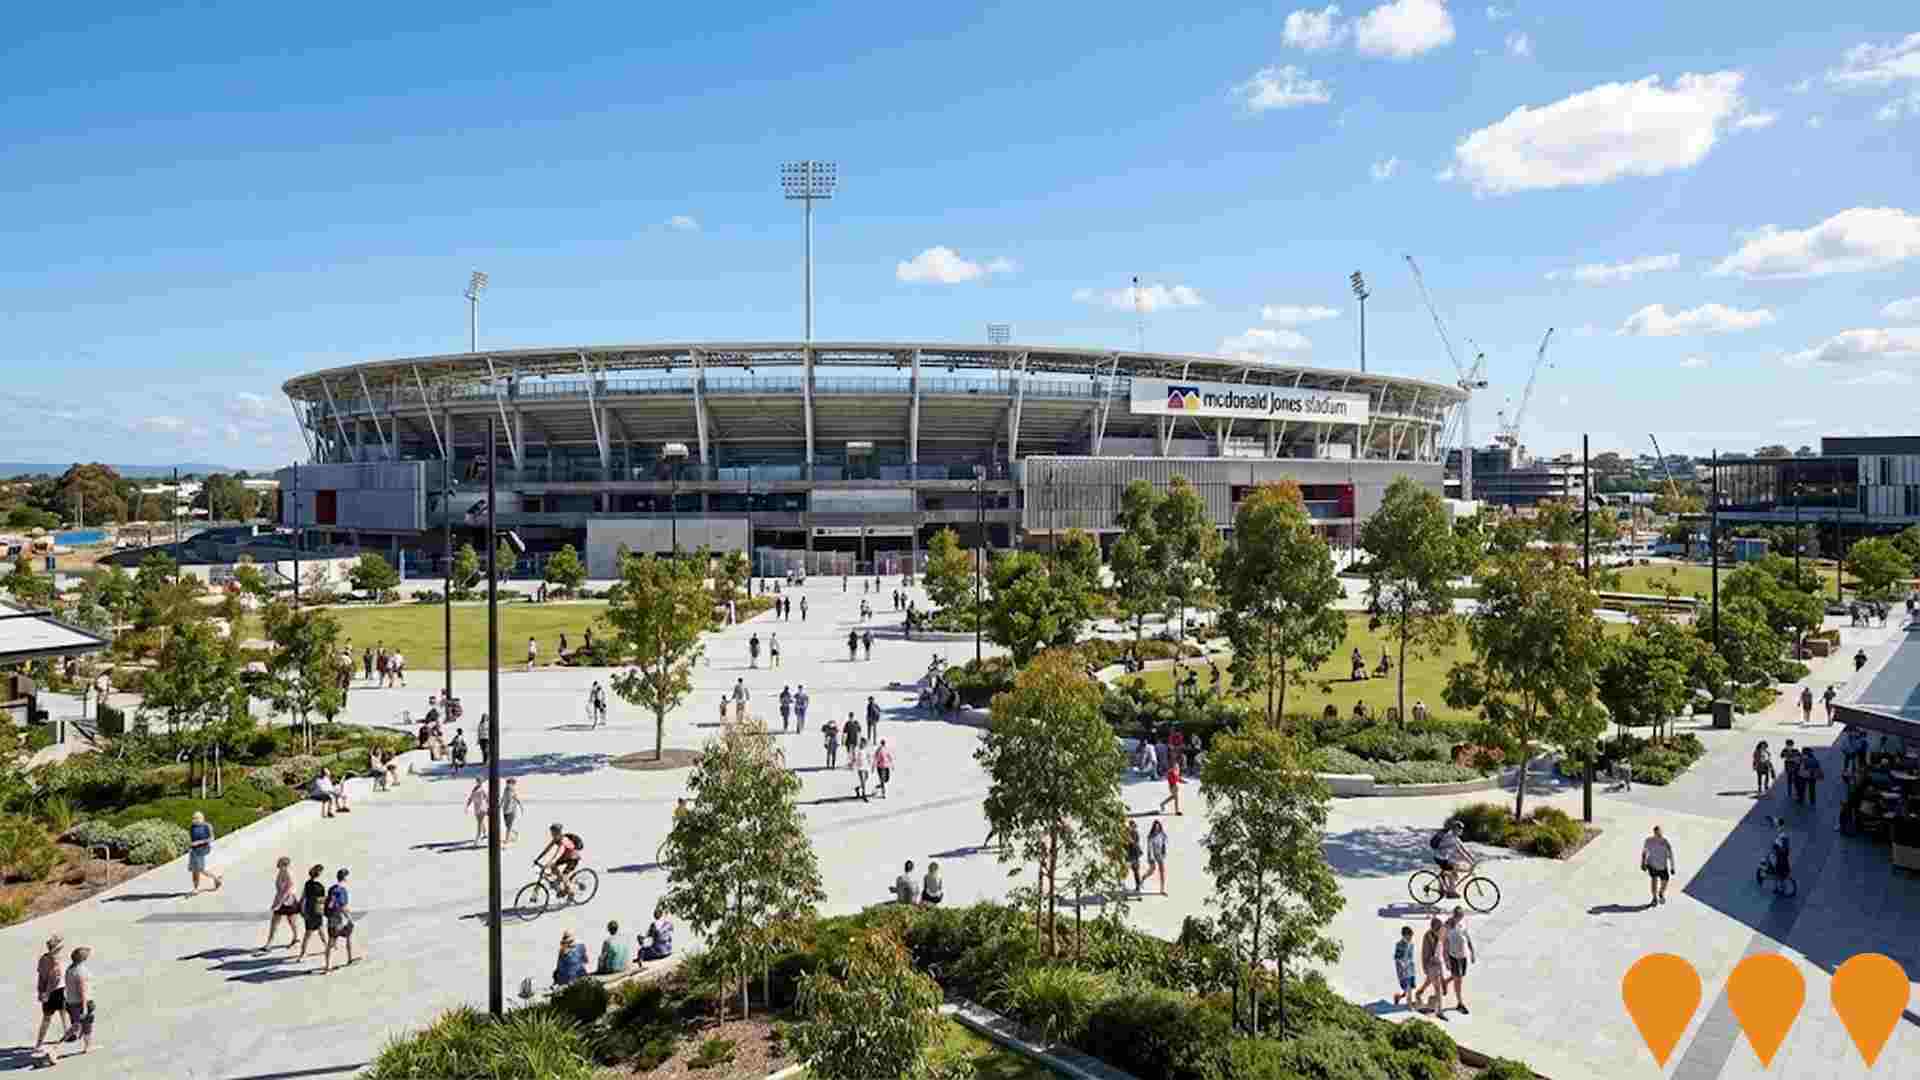
Waratah Park Masterplan
A 10-year masterplan endorsed in April 2025 to maximize year-round use of sporting fields at Waratah Park. The plan includes upgraded field layouts for 5 rugby union/league grounds, 4 cricket ovals (3 turf and 1 synthetic), and 8 oztag fields. Proposed improvements feature upgraded LED floodlights, irrigation and drainage systems, a formalised car park with accessible spaces, upgraded amenities, a 3-metre wide shared pathway around the park, fitness stations, multi-sport court, and informal seating. Stage 1 works (pending budget adoption) include a new toilet near the playground, a half-court for batball and basketball, and upgraded LED lighting at Waratah Park No.1 Sportsground. The masterplan was developed with key sporting stakeholders including Rugby Union, Rugby League, Cricket, Oztag, and Callaghan College, with community consultation completed in September 2024.

Employment
Employment performance in Mayfield - Warabrook has been below expectations when compared to most other areas nationally
Mayfield-Warrabrook has an educated workforce with significant representation in essential services sectors. The unemployment rate was 5.3% as of September 2024, with estimated employment growth of 2.3%.
By September 2025, the unemployment rate rose to 6.8%, while Rest of NSW's rate was 3.8%. Workforce participation in Mayfield-Warrabrook was 62.7% compared to Rest of NSW's 56.4%. Leading employment industries were health care & social assistance, education & training, and retail trade. The area had a notable specialization in health care & social assistance, with an employment share 1.3 times the regional level.
However, agriculture, forestry & fishing was under-represented at 0.5% compared to Rest of NSW's 5.3%. The ratio of workers to residents indicated higher local employment opportunities than usual. Between September 2024 and September 2025, employment levels increased by 2.3%, while the labour force grew by 3.4%, leading to a 1.0 percentage point rise in unemployment rate. In contrast, Rest of NSW saw employment decline by 0.5% and labour force decline by 0.1%. State-level data for NSW from 25-Nov-25 showed employment contraction of 0.03% (losing 2,260 jobs) with a state unemployment rate of 3.9%, favourably comparing to the national rate of 4.3%. Jobs and Skills Australia's national employment forecasts for Mayfield-Warrabrook, based on data from May-25, projected national employment growth of 6.6% over five years and 13.7% over ten years. Applying these projections to Mayfield-Warrabrook's employment mix suggested local employment should increase by 7.0% over five years and 14.5% over ten years.
Frequently Asked Questions - Employment
Income
Income levels align closely with national averages, indicating typical economic conditions for Australian communities according to AreaSearch analysis
AreaSearch's latest postcode level ATO data for financial year 2022 shows that Mayfield - Warabrook SA2 had a median income of $53,451 and an average income of $62,683. This contrasts with Rest of NSW's median income of $49,459 and average income of $62,998. By September 2025, estimates suggest the median income could be approximately $60,191 and the average income around $70,587, based on a Wage Price Index growth of 12.61% since financial year 2022. The 2021 Census data ranks Mayfield - Warabrook's household, family, and personal incomes modestly, between the 41st and 51st percentiles. Income distribution shows that 33.4% of individuals earn between $1,500 and $2,999, consistent with broader trends across the region at 29.9%. Housing affordability pressures are severe, with only 81.2% of income remaining, ranking at the 39th percentile. The area's SEIFA income ranking places it in the 4th decile.
Frequently Asked Questions - Income
Housing
Mayfield - Warabrook is characterized by a predominantly suburban housing profile, with a higher proportion of rental properties than the broader region
Dwelling structure in Mayfield-Warrabrook, as per the latest Census, consisted of 75.7% houses and 24.3% other dwellings (semi-detached, apartments, 'other' dwellings). In comparison, Non-Metro NSW had 70.5% houses and 29.5% other dwellings. Home ownership in Mayfield-Warrabrook was at 25.4%, with the rest either mortgaged (34.2%) or rented (40.4%). The median monthly mortgage repayment was $1,883, lower than Non-Metro NSW's average of $1,962. The median weekly rent was $380, compared to Non-Metro NSW's $400. Nationally, Mayfield-Warrabrook's mortgage repayments were higher at $1,883, while rents exceeded the national figure of $375.
Frequently Asked Questions - Housing
Household Composition
Mayfield - Warabrook features high concentrations of group households and lone person households, with a lower-than-average median household size
Family households constitute 59.8% of all households, composed of 22.0% couples with children, 24.3% couples without children, and 11.9% single parent families. Non-family households account for the remaining 40.2%, with lone person households at 32.7% and group households making up 7.4%. The median household size is 2.2 people, which is smaller than the Rest of NSW average of 2.4.
Frequently Asked Questions - Households
Local Schools & Education
Educational attainment in Mayfield - Warabrook aligns closely with national averages, showing typical qualification patterns and performance metrics
The area's university qualification rate is 29.3%, higher than the Rest of NSW average of 21.3% and the SA4 region's rate of 26.1%. Bachelor degrees are most common at 20.2%, followed by postgraduate qualifications (6.6%) and graduate diplomas (2.5%). Vocational credentials are held by 34.4% of residents aged 15+, with advanced diplomas at 10.0% and certificates at 24.4%.
Educational participation is high, with 27.7% of residents currently enrolled in formal education. This includes 8.1% in tertiary education, 7.7% in primary education, and 5.2% pursuing secondary education.
Frequently Asked Questions - Education
Schools Detail
Nearby Services & Amenities
Transport
Transport servicing is high compared to other areas nationally based on assessment of service frequency, route connectivity and accessibility
The analysis of public transport in Mayfield-Warabrook shows that there are currently 153 active transport stops operating. These stops offer a mix of train and bus services. They are serviced by 69 individual routes which collectively provide 5,584 weekly passenger trips.
The report rates the transport accessibility as excellent with residents typically located 126 meters from the nearest transport stop. On average, service frequency across all routes is 797 trips per day, equating to approximately 36 weekly trips per individual stop.
Frequently Asked Questions - Transport
Transport Stops Detail
Health
Health performance in Mayfield - Warabrook is well below average with a range of health conditions having marked impacts on both younger and older age cohorts
Mayfield-Warrabrook faces significant health challenges, as indicated by health data. A variety of health conditions affect both younger and older residents.
The area has a private health cover rate of approximately 51% (~8,238 people), slightly lower than the average SA2 area's 55.6%. Mental health issues and asthma are the most common medical conditions, affecting 13.7% and 8.8% of residents respectively. About 60.8% of residents report no medical ailments, compared to 64.9% in Rest of NSW. The area has a lower proportion of seniors aged 65 and over at 15.4% (2,486 people), compared to the 16.7% in Rest of NSW. Senior health outcomes largely align with the general population's health profile.
Frequently Asked Questions - Health
Cultural Diversity
Mayfield - Warabrook ranks below the Australian average when compared to other local markets across a number of language and cultural background related metrics
Mayfield-Warrabrook was found to be below average in terms of cultural diversity, with 85.3% of its population born in Australia, 90.0% being citizens, and 90.2% speaking English only at home. The main religion in Mayfield-Warrabrook is Christianity, comprising 45.2% of the population. However, Judaism is notably overrepresented, making up 0.1% of the population compared to the region's average of 0.1%.
In terms of ancestry, the top three represented groups are English (29.1%), Australian (27.0%), and Irish (9.5%). There are notable divergences in the representation of certain ethnic groups: Welsh is overrepresented at 0.8% compared to the regional average of 0.8%, Macedonian at 0.6% versus 0.8%, and Samoan at 0.3% versus 0.1%.
Frequently Asked Questions - Diversity
Age
Mayfield - Warabrook's population is slightly younger than the national pattern
The median age in Mayfield - Warabrook as of May was 36 years, significantly lower than Rest of NSW's average of 43 years, and somewhat younger than Australia's median age of 38 years. The 25-34 age group constituted 21.8% of the population, compared to Rest of NSW's percentage, while the 65-74 cohort made up 8.7%. This concentration of individuals aged 25-34 was well above the national average of 14.5%. Post-2021 Census data indicated that Mayfield - Warabrook had become younger, with the median age dropping from 37 to 36 years between censuses. The 25-34 age group grew from 19.3% to 21.8%, and the 35-44 cohort increased from 14.1% to 15.4%. Conversely, the 55-64 cohort declined from 11.4% to 10.0%, and the 45-54 group dropped from 11.3% to 10.1%. By 2041, Mayfield - Warabrook is projected to experience significant shifts in its age composition. The 25-34 age cohort is expected to grow by 924 people (26%), from 3,506 to 4,431. Conversely, population declines are projected for the 65-74 and 15-24 cohorts.
