Chart Color Schemes
This analysis uses ABS Statistical Areas Level 2 (SA2) boundaries, which can materially differ from Suburbs and Localities (SAL) even when sharing similar names.
SA2 boundaries are defined by the Australian Bureau of Statistics and are designed to represent communities for statistical reporting (e.g., census and ERP).
Suburbs and Localities (SAL) represent commonly-used suburb/locality names (postal-style areas) and may use different geographic boundaries. For comprehensive analysis, consider reviewing both boundary types if available.
est. as @ -- *
ABS ERP | -- people | --
2021 Census | -- people
Sales Activity
Curious about local property values? Filter the chart to assess the volume and appreciation (including resales) trends and regional comparisons, or scroll to the map below view this information at an individual property level.
Find a Recent Sale
Sales Detail
Population
An assessment of population growth drivers in Bilpin - Colo - St Albans reveals an overall ranking slightly below national averages considering recent, and medium term trends
AreaSearch's analysis indicates Bilpin - Colo - St Albans' population was approximately 2,819 as of Nov 2025. This reflects a decrease of 27 people since the 2021 Census, which reported a population of 2,846. The change is inferred from ABS's estimated resident population of 2,807 in June 2024 and an additional 9 validated new addresses since the Census date. This results in a density ratio of 1.3 persons per square kilometer. Over the past decade, Bilpin - Colo - St Albans showed resilient growth patterns with a compound annual growth rate of 0.2%, outpacing its SA3 area. Population growth was primarily driven by overseas migration contributing approximately 72.7% of overall population gains during recent periods.
AreaSearch adopts ABS/Geoscience Australia projections for each SA2 area, released in 2024 with a base year of 2022. For areas not covered, NSW State Government's SA2 level projections are used, released in 2022 with a base year of 2021. Growth rates by age group from these aggregations are applied to all areas for years 2032 to 2041. According to this methodology, the area's population is expected to decline by 267 persons by 2041. However, growth across specific age cohorts is anticipated, with the 85 and over age group projected to expand by 131 people.
Frequently Asked Questions - Population
Development
The level of residential development activity in Bilpin - Colo - St Albans is very low in comparison to the average area assessed nationally by AreaSearch
Bilpin-Colo-St Albans has seen approximately five dwellings granted development approval annually over the past five financial years, totaling 25 homes. As of FY-26, three approvals have been recorded so far. The population decline in recent years has maintained adequate housing supply relative to demand, resulting in a balanced market with good buyer choice. New homes are being built at an average expected construction cost value of $408,000.
This financial year, $6.2 million in commercial approvals have been registered, indicating the area's primarily residential nature. Compared to Greater Sydney, Bilpin-Colo-St Albans has 14.0% less new development per person and ranks among the 29th percentile of areas assessed nationally, offering more limited choices for buyers and supporting demand for existing dwellings. This is reflective of the area's maturity and possible planning constraints. All new construction in the area consists of detached dwellings, preserving its traditional low-density character with a focus on family homes appealing to those seeking space.
The estimated population per dwelling approval is 670 people, reflecting its quiet development environment. Given stable or declining population forecasts, Bilpin-Colo-St Albans may experience less housing pressure in the future, creating favorable conditions for buyers.
Frequently Asked Questions - Development
Infrastructure
Bilpin - Colo - St Albans has moderate levels of nearby infrastructure activity, ranking in the top 50% nationally
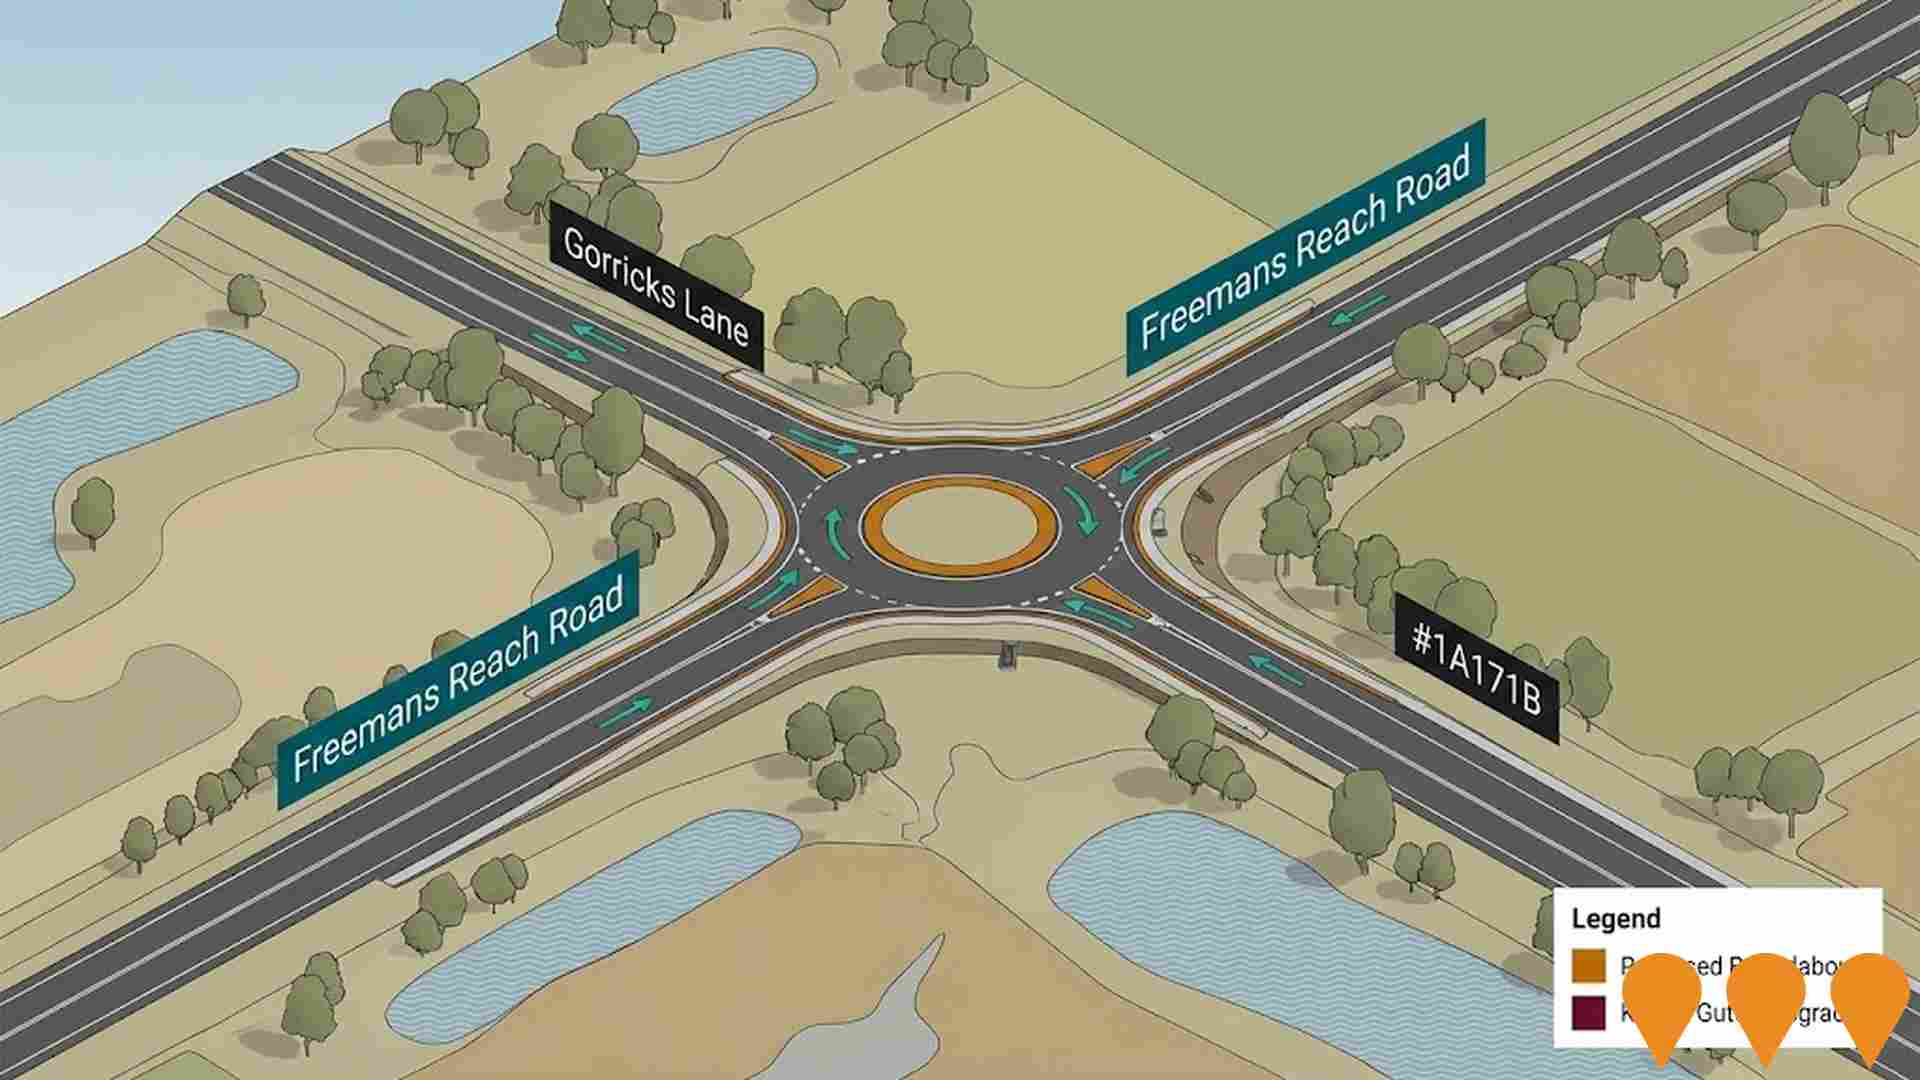
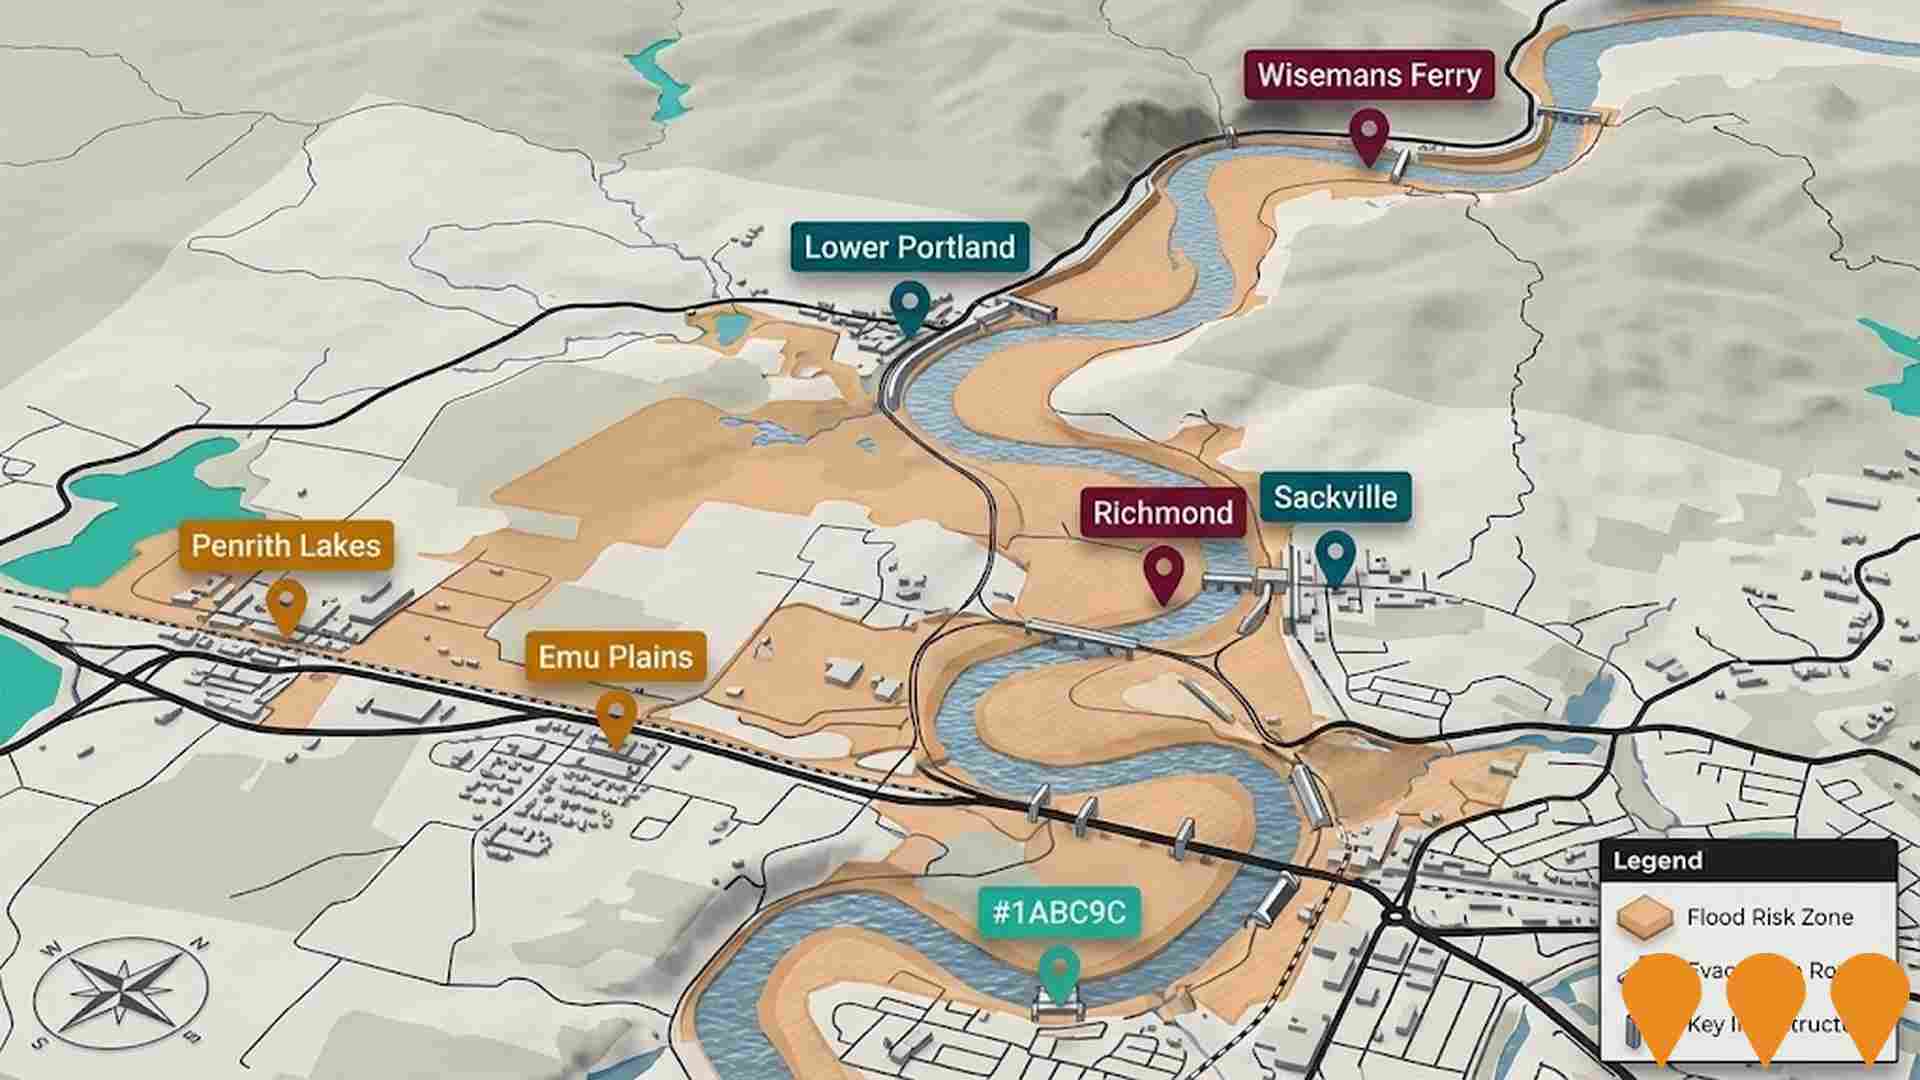
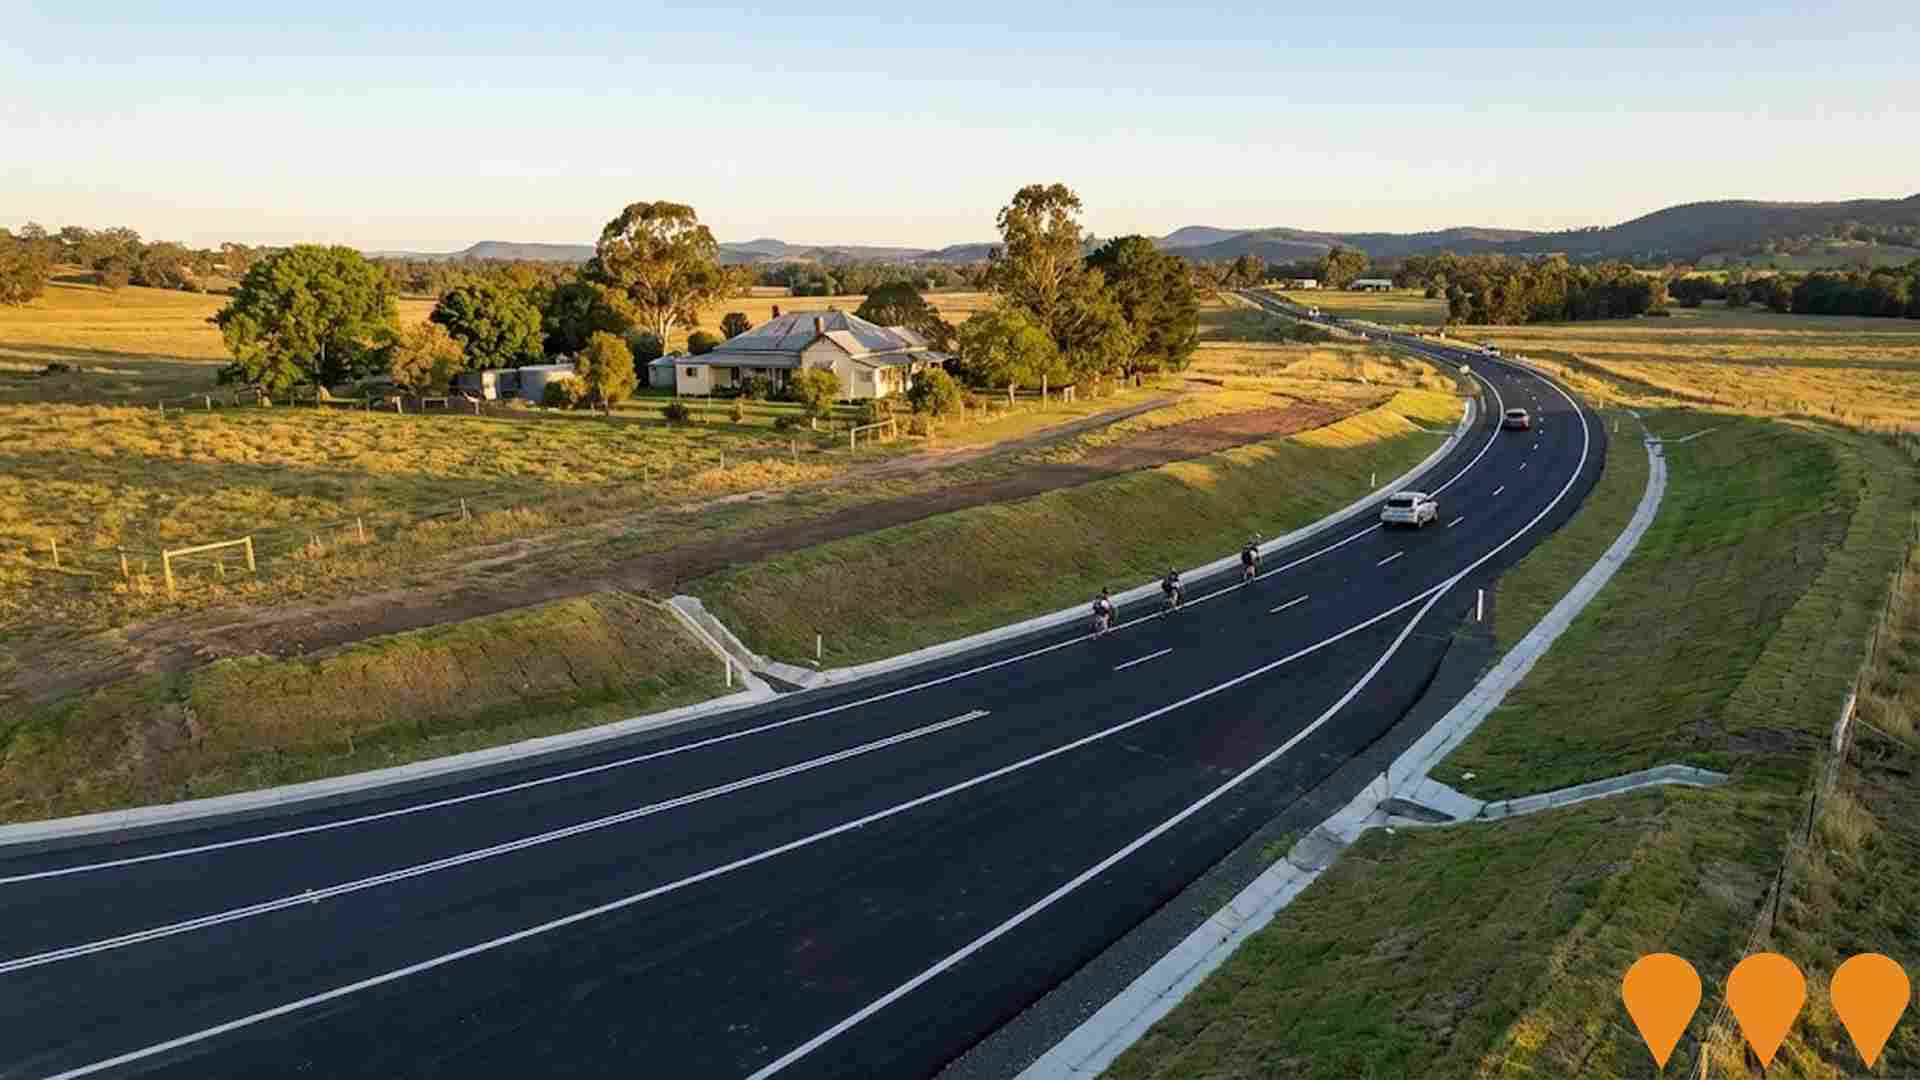
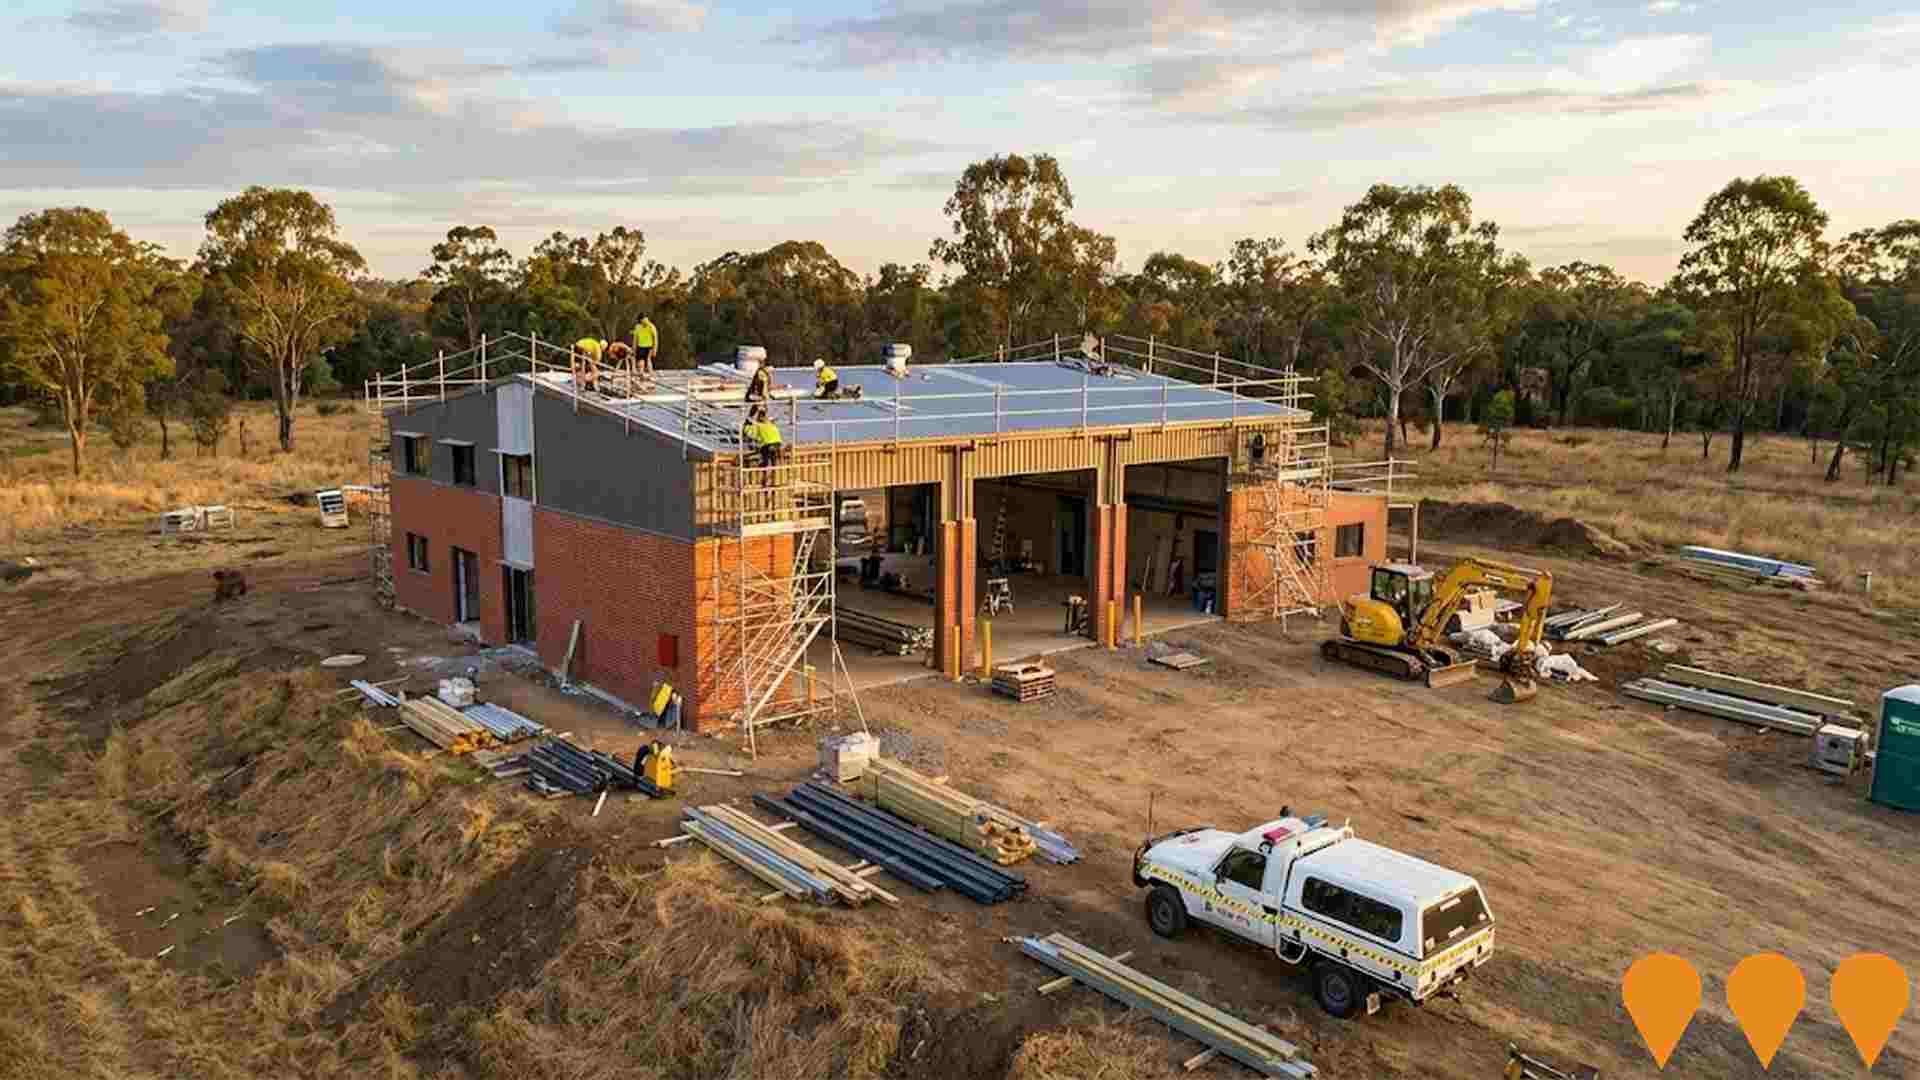
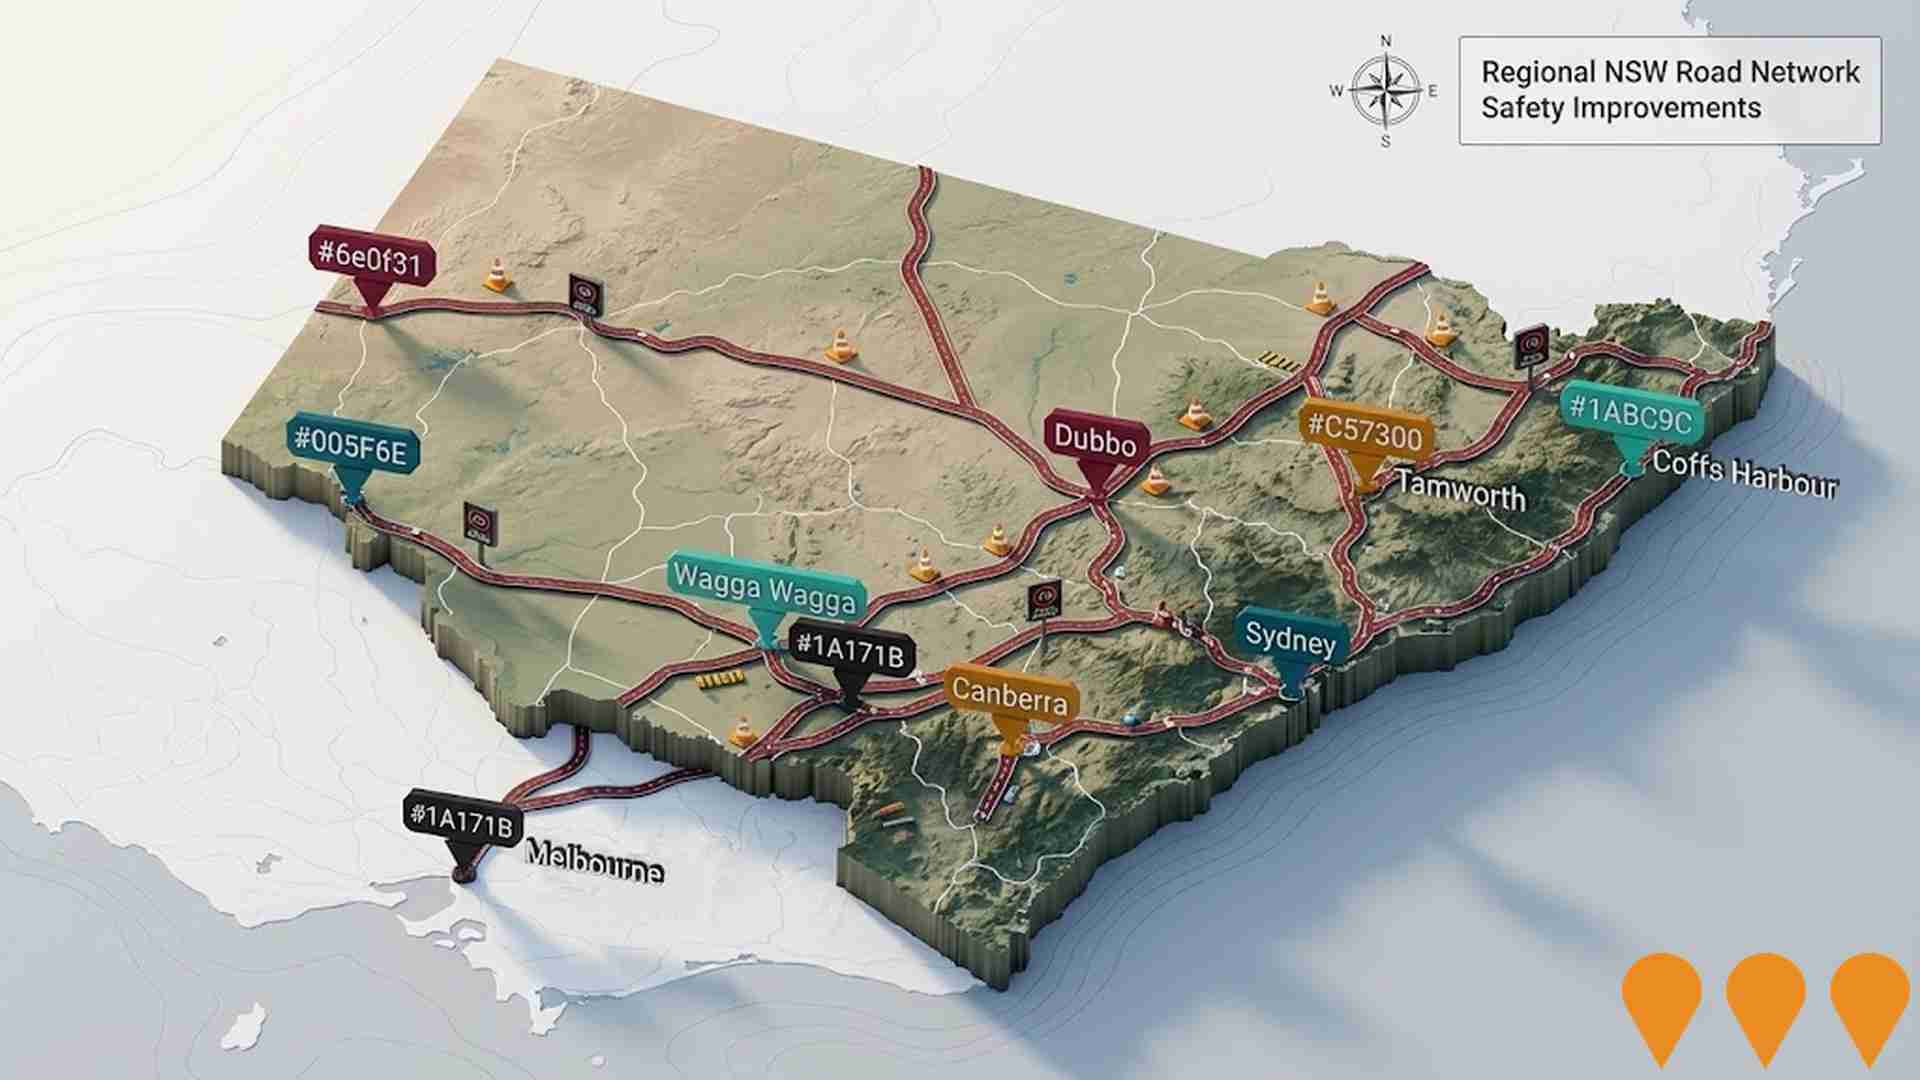
AreaSearch has identified 13 infrastructure projects that could impact the area. Key projects include Jacaranda Ponds, Hawkesbury-Nepean Valley Flood Management, Road Improvement Program - Wire Lane, Freemans Reach, and Freemans Reach Fire Brigade Station. The following list details those likely to be most relevant.
Professional plan users can use the search below to filter and access additional projects.
INFRASTRUCTURE SEARCH
 Denotes AI-based impression for illustrative purposes only, not to be taken as definitive under any circumstances. Please follow links and conduct other investigations from the project's source for actual imagery. Developers and project owners wishing us to use original imagery please Contact Us and we will do so.
Frequently Asked Questions - Infrastructure
Low and Mid-Rise Housing Policy
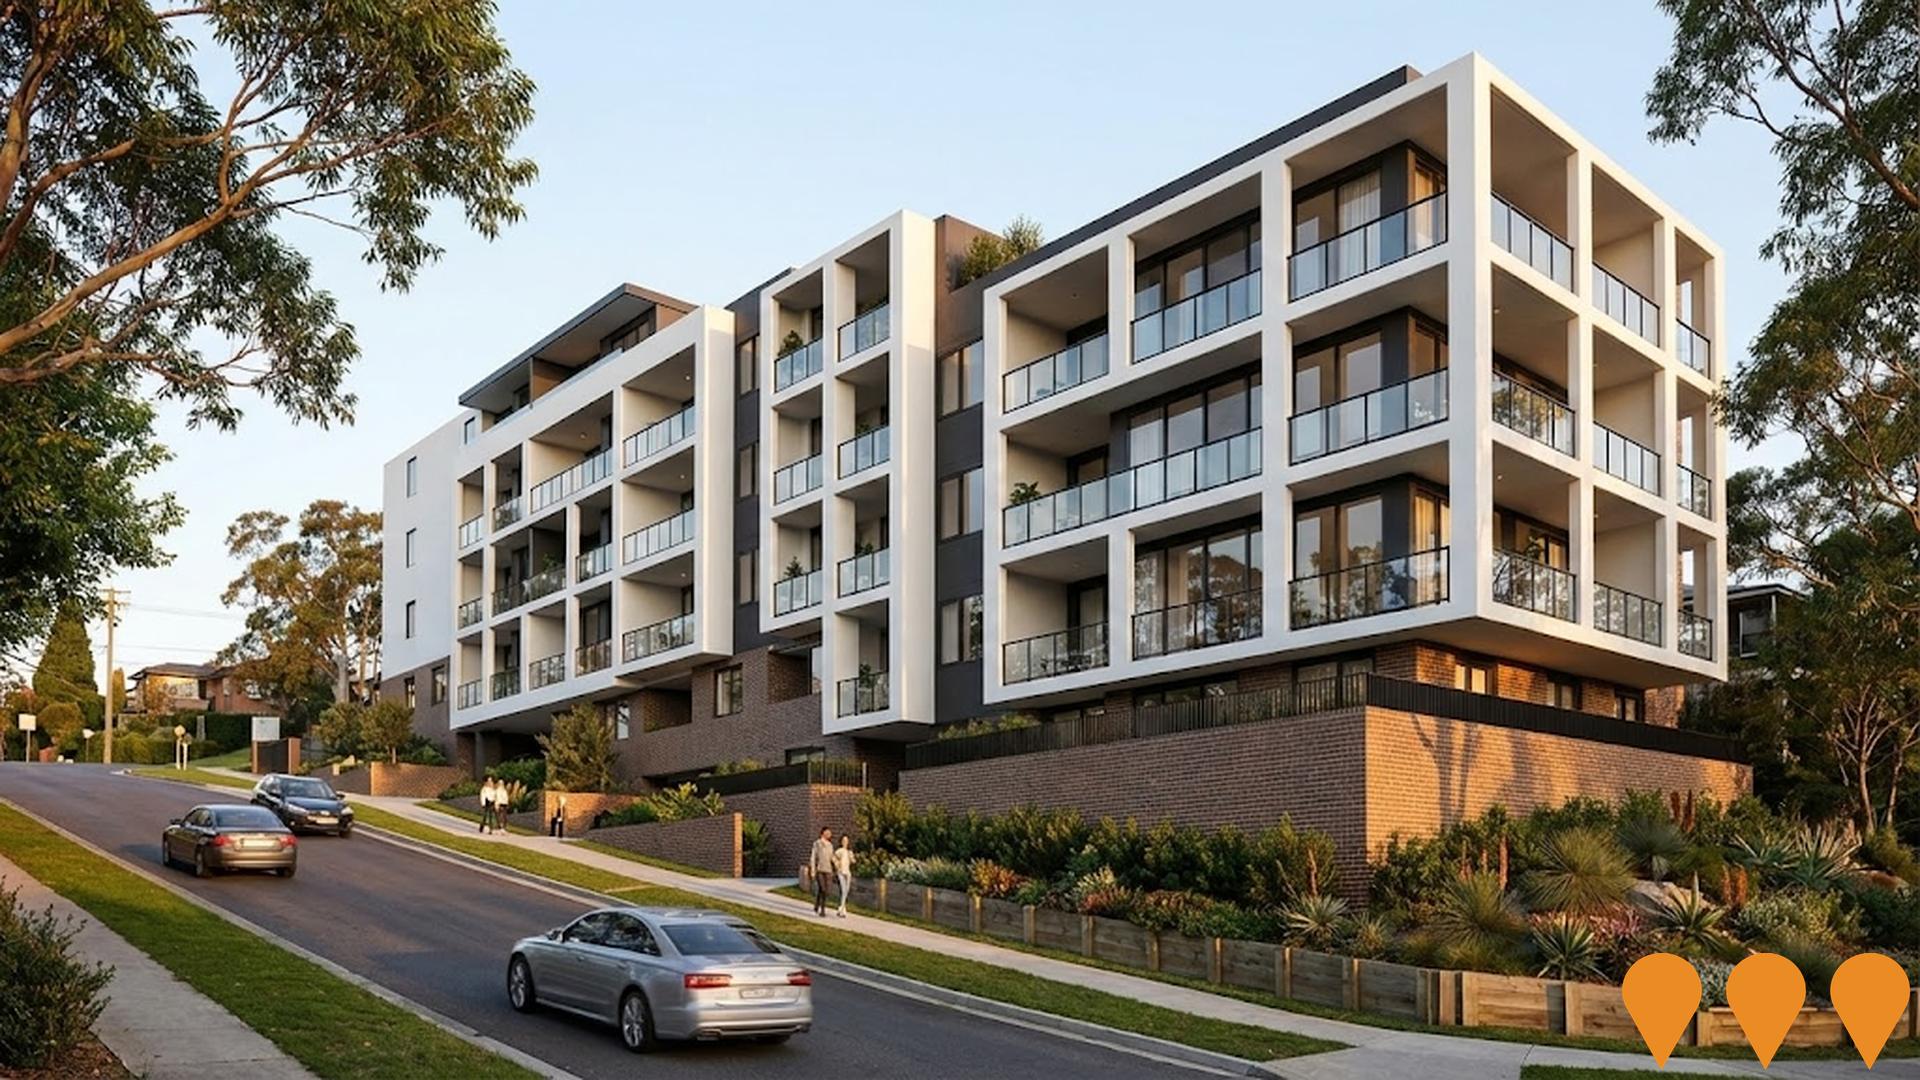
State-wide NSW planning reforms via amendments to the State Environmental Planning Policy to enable more diverse low and mid-rise housing (dual occupancies, terraces, townhouses, manor houses and residential flat buildings up to 6 storeys) in well-located areas within 800 m of selected train, metro and light-rail stations and town centres. Stage 1 (dual occupancies in R2 zones statewide) commenced 1 July 2024. Stage 2 (mid-rise apartments, terraces and dual occupancies near stations) commenced 28 February 2025. Expected to facilitate up to 112,000 additional homes over the next five years.
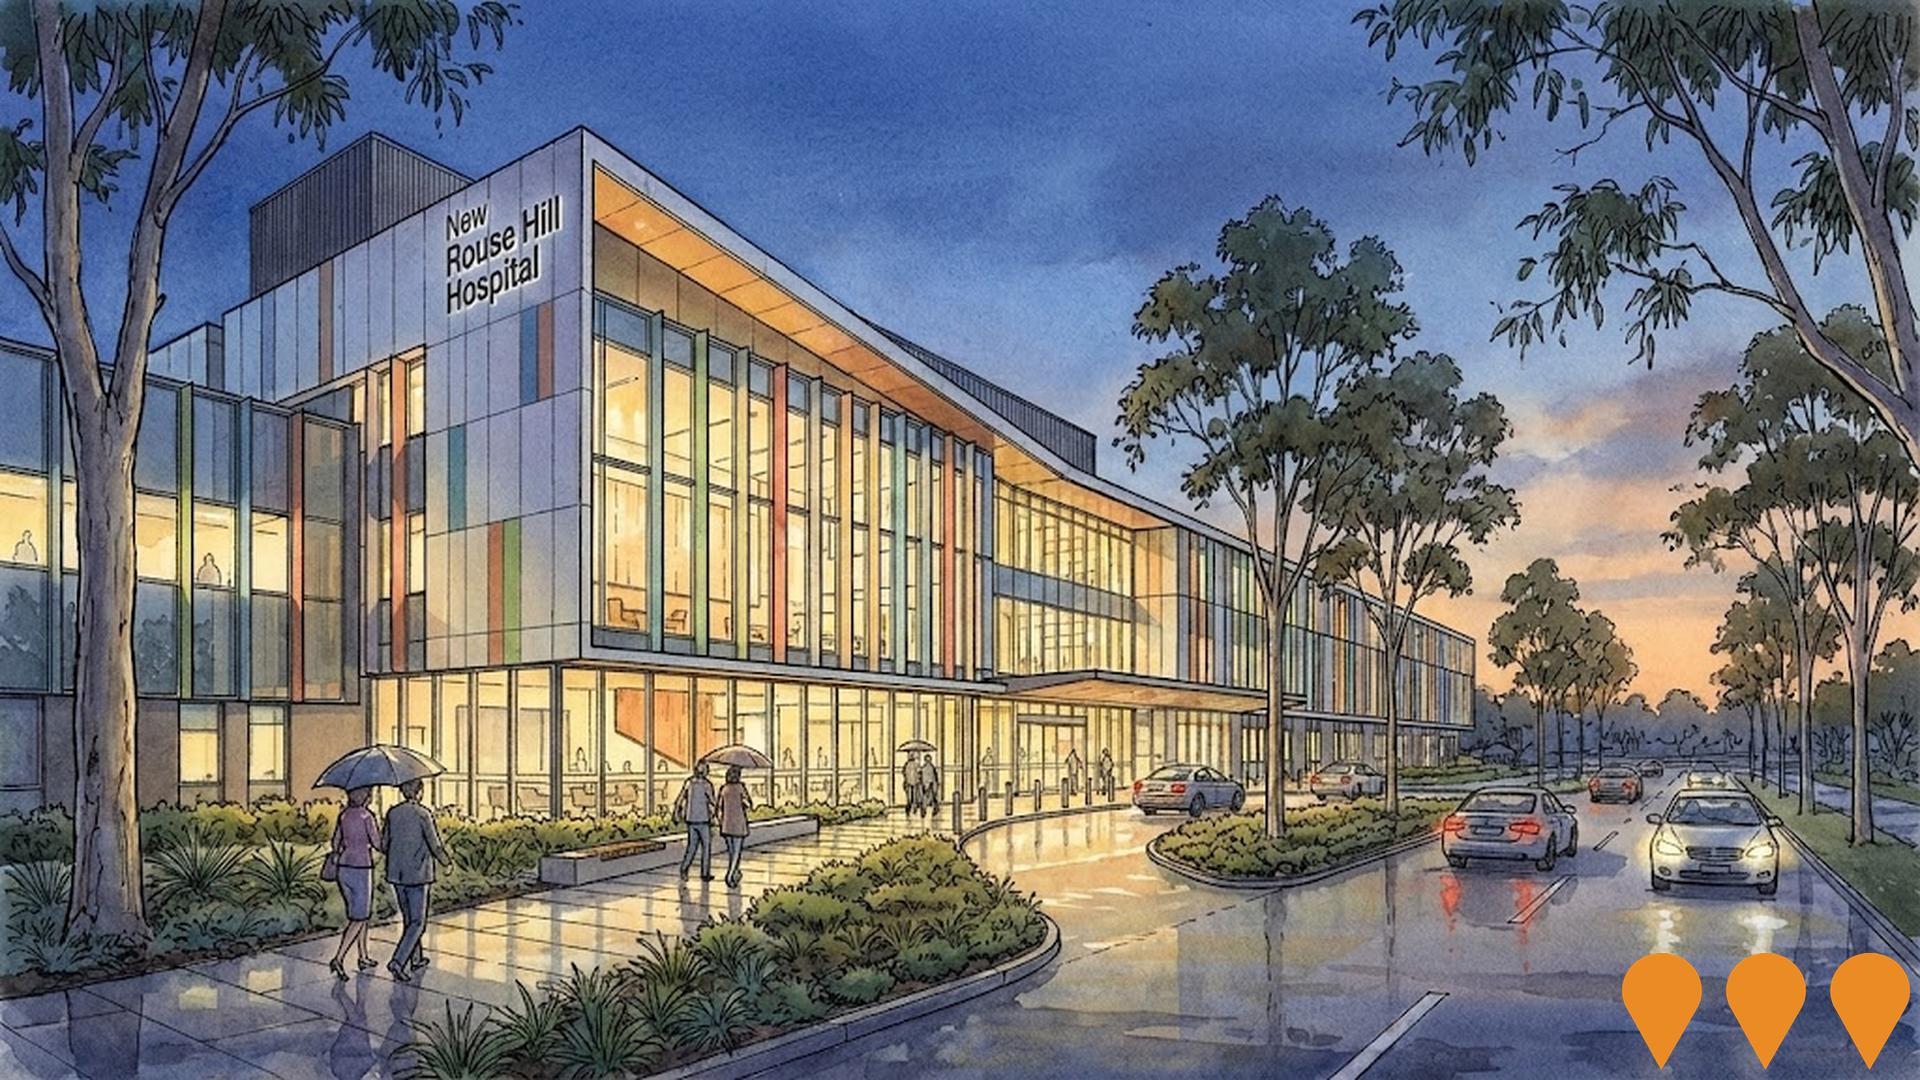
Rouse Hill Hospital
New $910 million public hospital serving Sydney's north-west growth corridor. 300+ beds, emergency department, maternity, ICU, operating theatres, paediatrics, renal dialysis, medical imaging and integrated digital health. First major adult public hospital built in Western Sydney in over 40 years. SSDA for main works lodged and on public exhibition until 10 December 2025. Early works contractor appointment imminent. Main construction expected to start late 2025/early 2026, with staged opening from 2028.
Redbank North Richmond Master-Planned Community
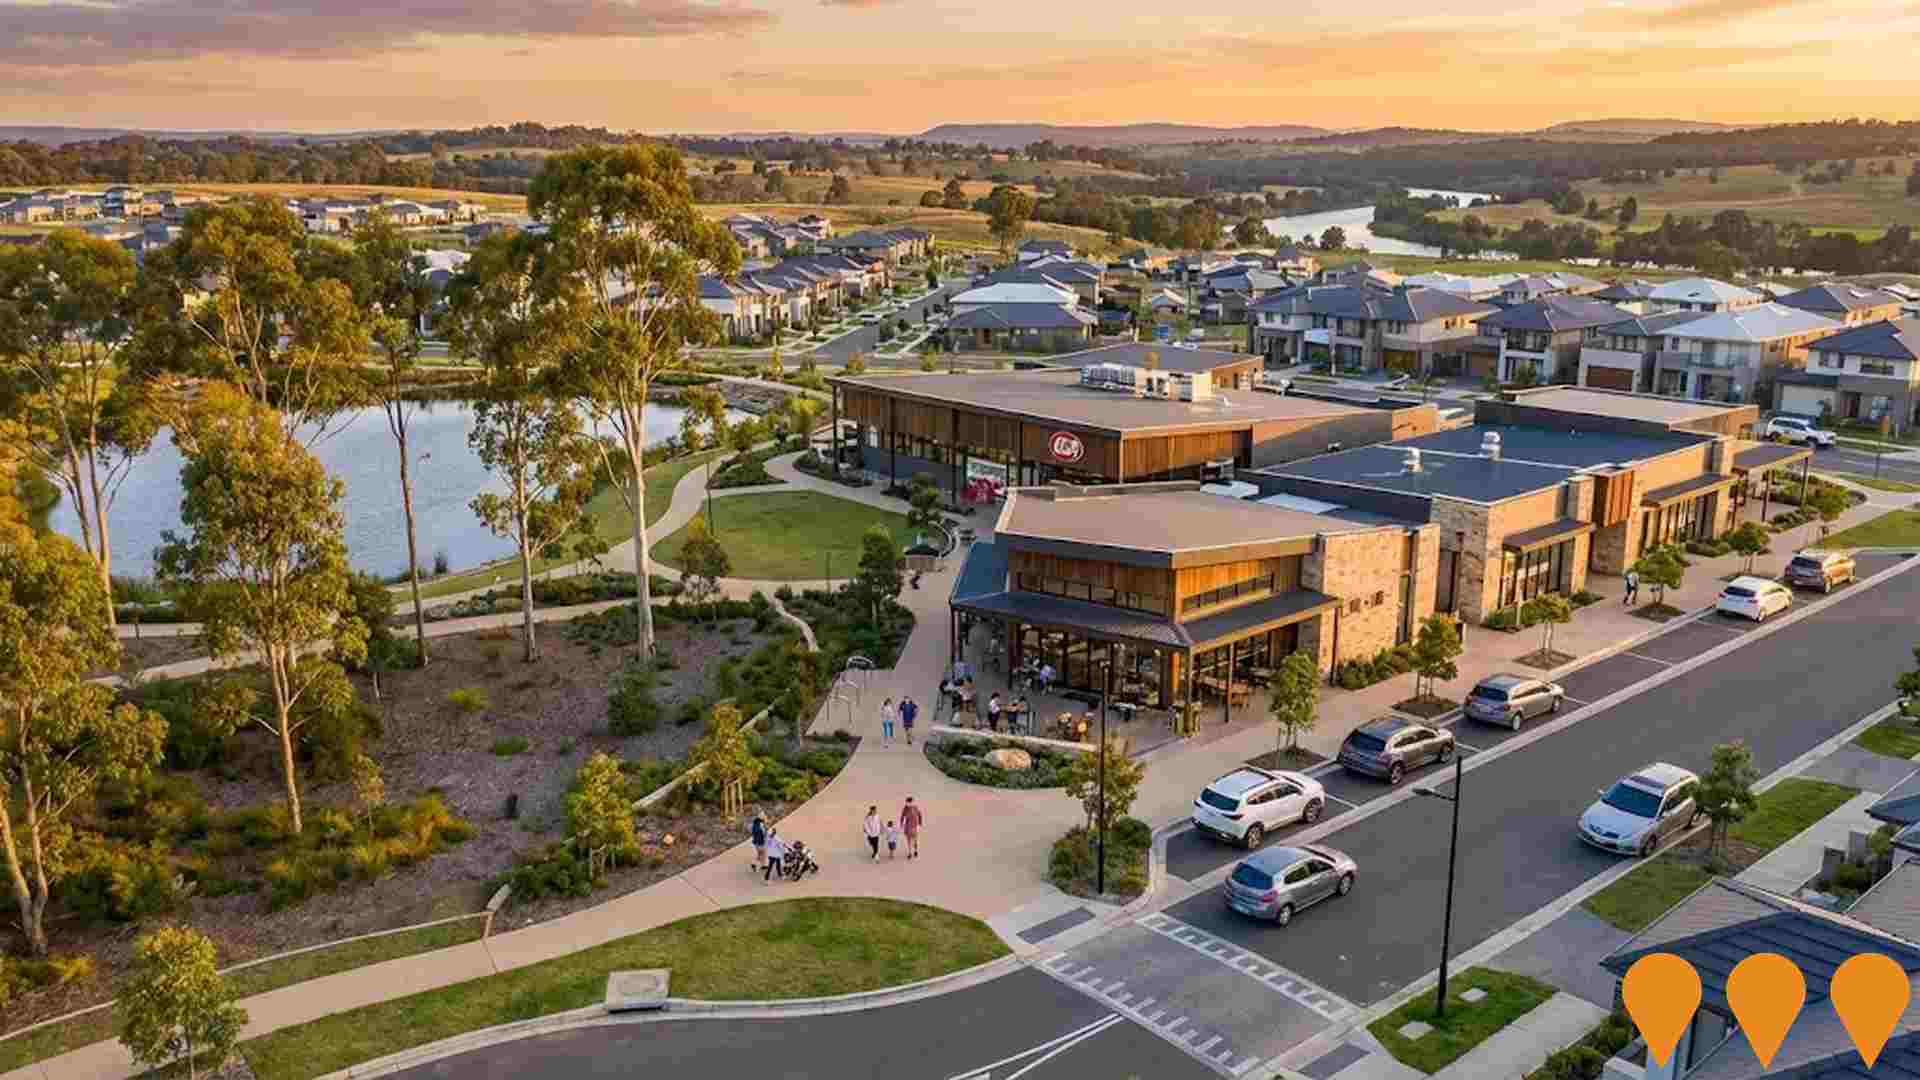
Redbank North Richmond is a 180 hectare master planned community in the Hawkesbury that will deliver about 1,399 detached homes plus an 80 bed aged care facility and a 192 home retirement village, alongside extensive parklands and open space. The $1.8 billion project includes a village centre with a cafe and restaurant, vet hospital and supermarket, with stage 2 of the Redbank Village centre and an IGA supermarket now under construction. The estate is well advanced, with planning reports noting that more than 900 lots have been sold, around 914 lots registered and about 700 lots already occupied, while new stages such as Cumberland Place and The Promenade continue to be released. Recent council planning proposals focus on minor zoning and control amendments across the existing estate and do not increase dwelling yield, while a separate planning proposal covers a Redbank expansion area at Kemsley Park. The community is supported by new childcare and community facilities, and future regional connectivity is to be improved through the proposed Grose River Bridge project being delivered in partnership with Transport for NSW and Hawkesbury City Council. :contentReference[oaicite:0]{index=0} :contentReference[oaicite:1]{index=1} :contentReference[oaicite:2]{index=2}
New Richmond Bridge and Traffic Improvements
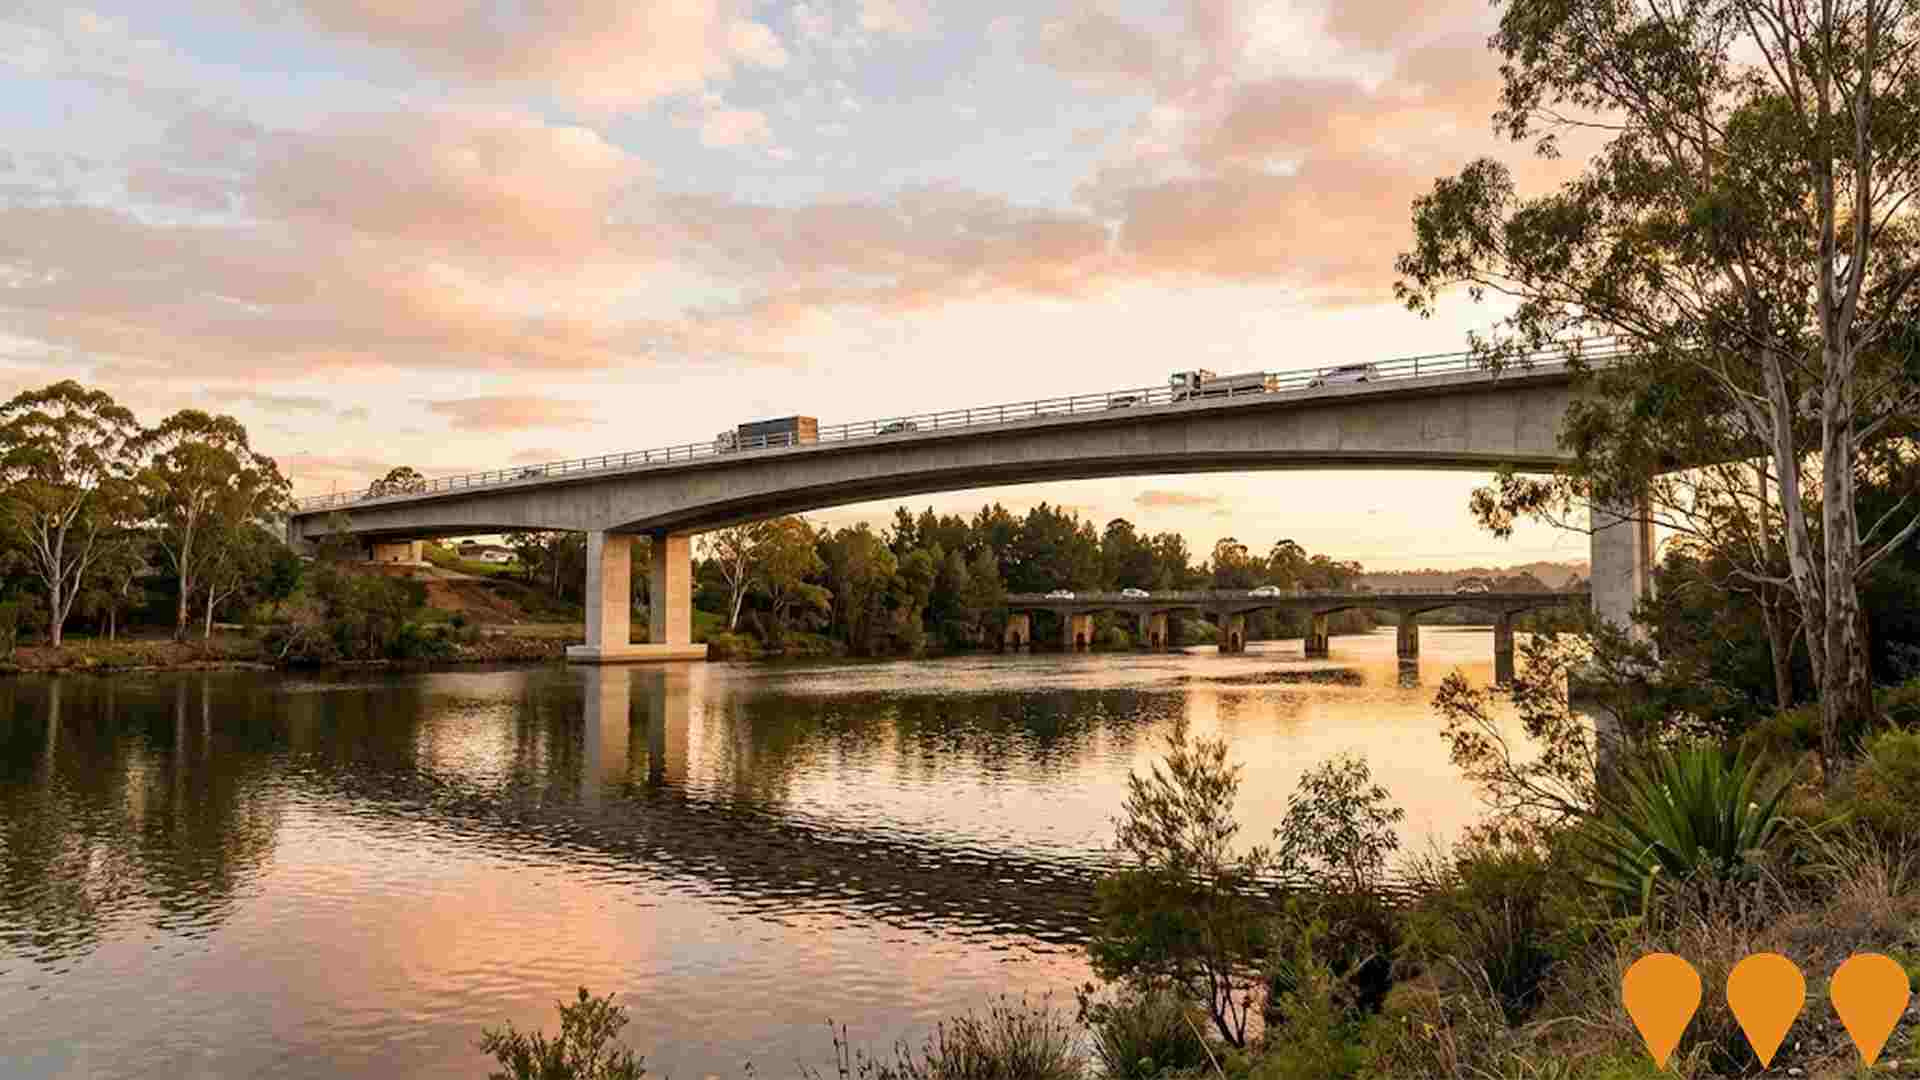
Traffic and flood-resilience upgrade led by Transport for NSW delivering a new higher four-lane bridge over the Hawkesbury River downstream of the existing Richmond Bridge, a bypass of Richmond town centre, and upgrades to key intersections on The Driftway. Stage 1 (The Driftway intersections and enabling works) has a major construction contract awarded and is commencing in 2025, with completion targeted for 2027. Stage 2 will deliver the new bridge and associated works, with design and procurement progressing following community consultation.
Newcastle-Sydney and Wollongong-Sydney Rail Line Upgrades
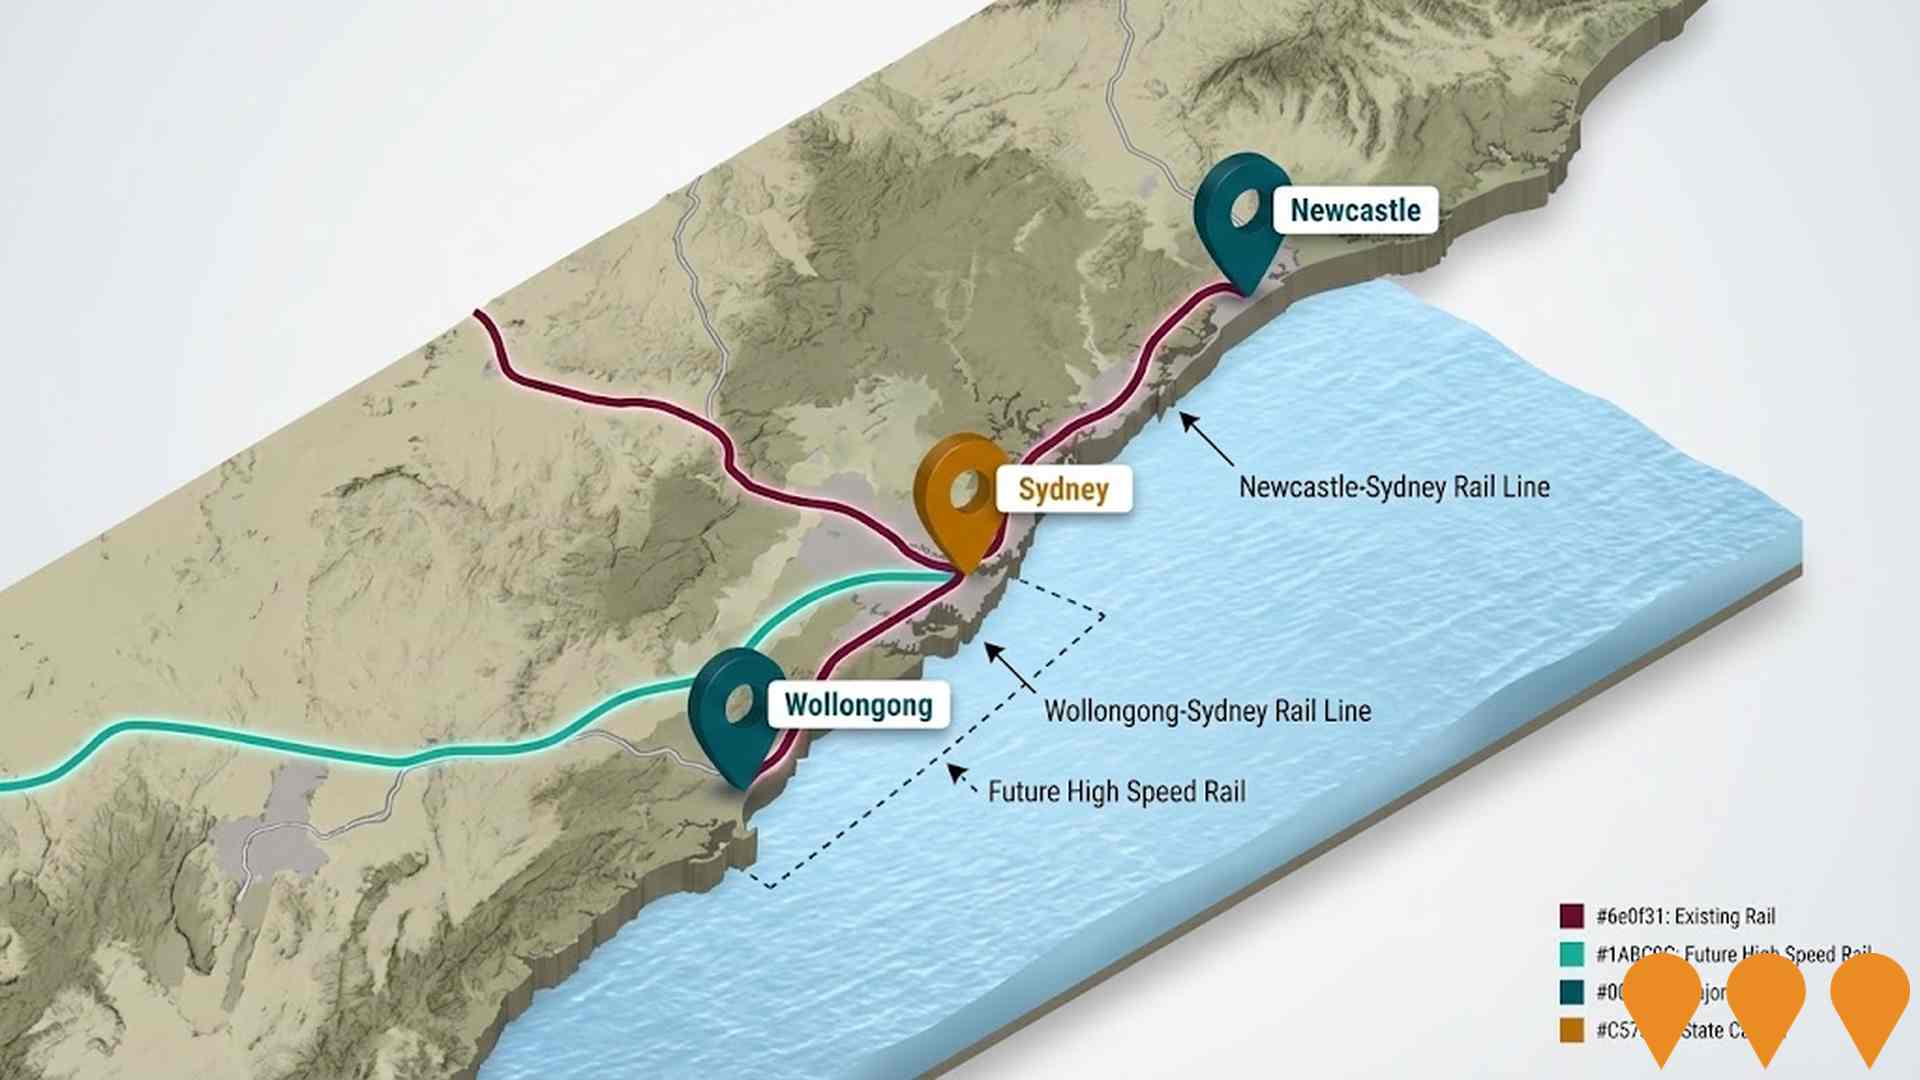
Program of upgrades to existing intercity rail corridors linking Newcastle-Central Coast-Sydney and Wollongong-Sydney to reduce travel times and improve reliability. Current scope includes timetable and service changes under the Rail Service Improvement Program, targeted network upgrades (signalling, power, station works) and the introduction of the Mariyung intercity fleet on the Central Coast & Newcastle Line, alongside Federal planning led by the High Speed Rail Authority for a dedicated Sydney-Newcastle high speed corridor.
Western Sydney Infrastructure Plan
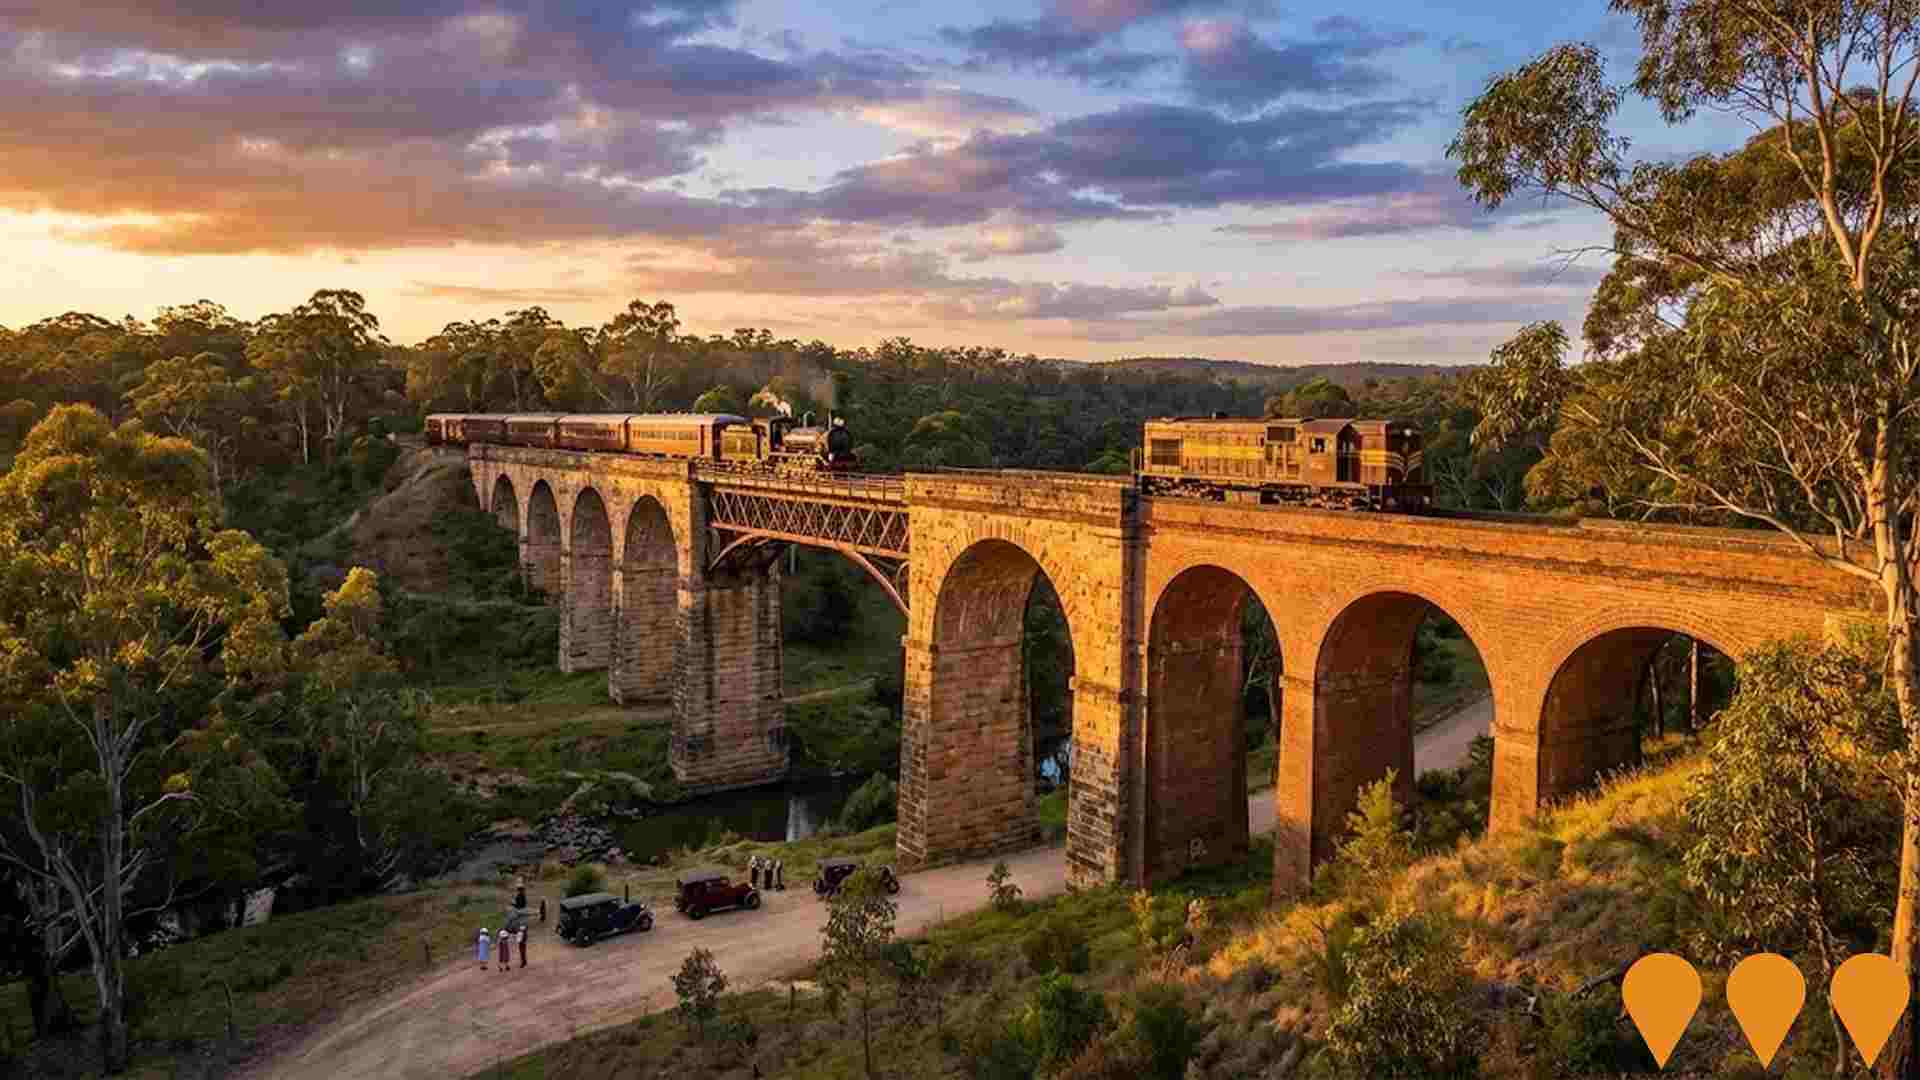
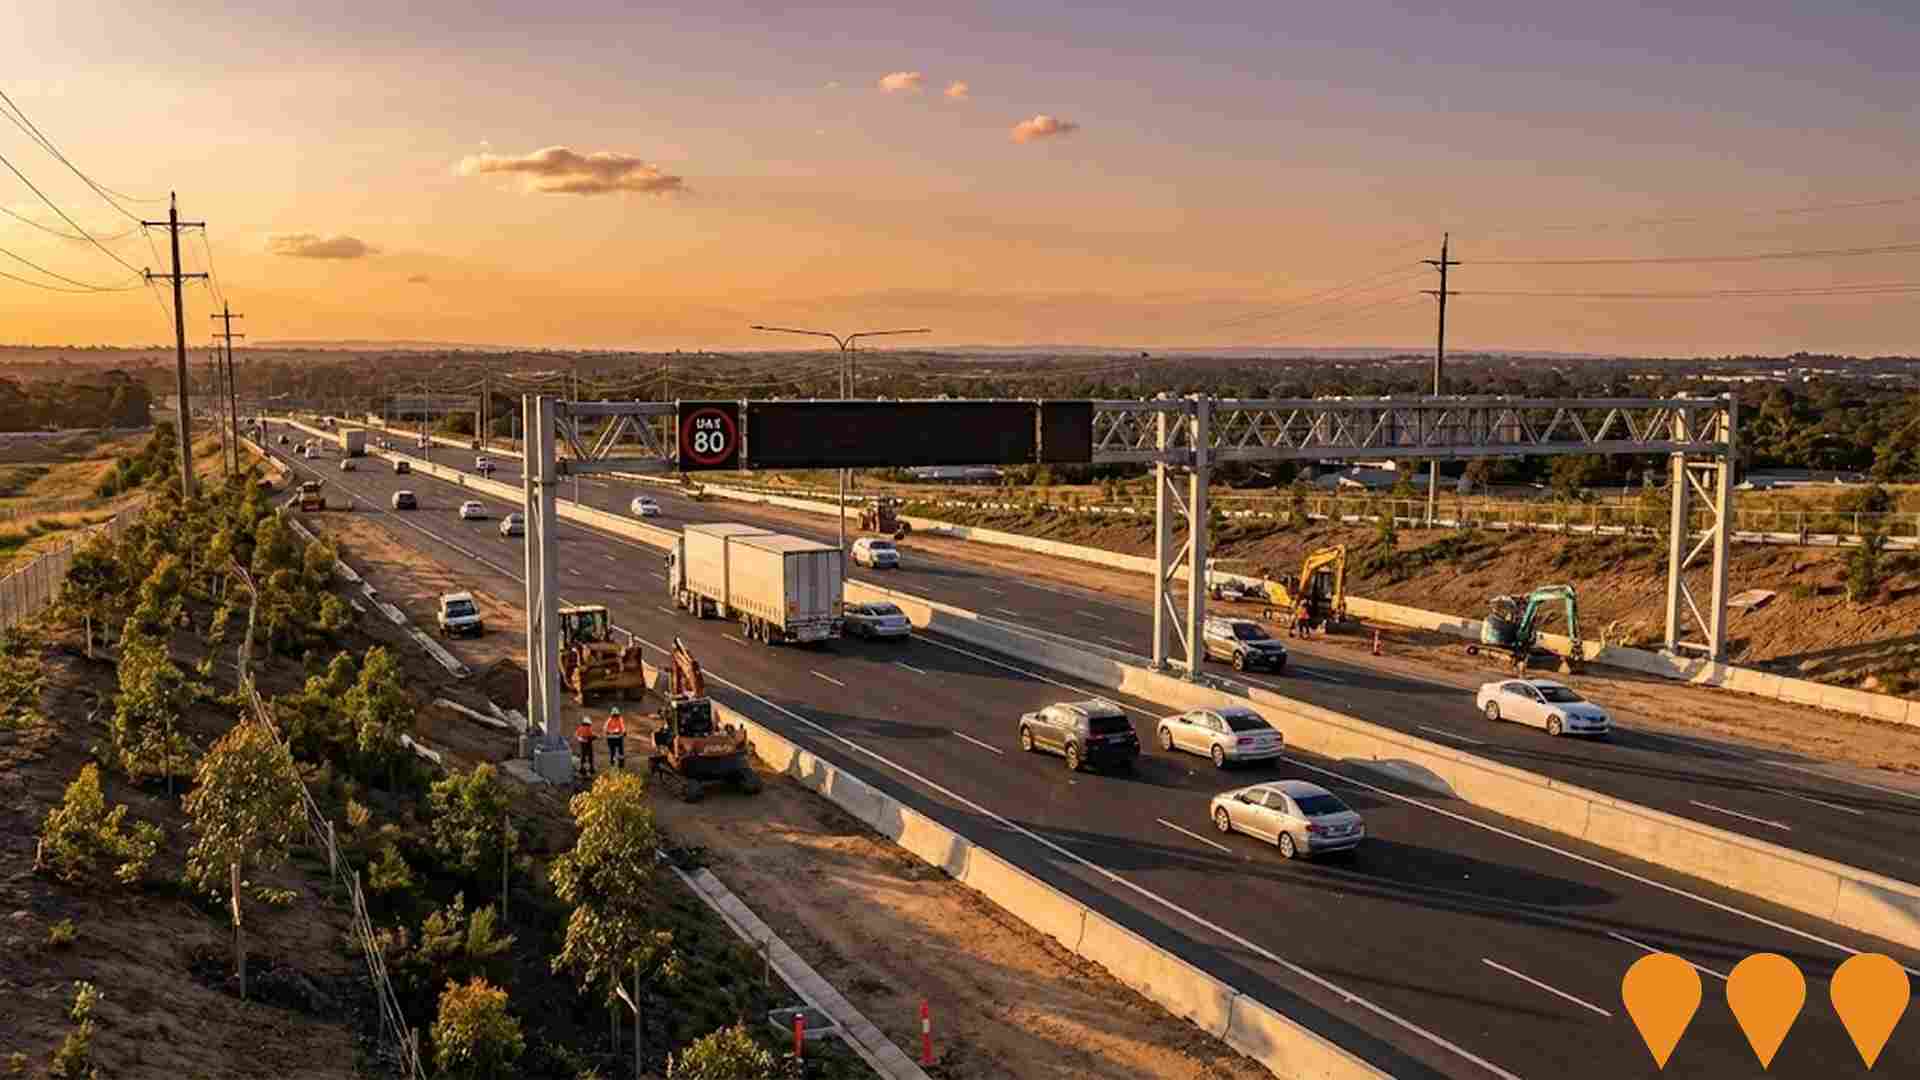
The Western Sydney Infrastructure Plan (WSIP) is a joint Australian and NSW Government 10-year, $4.4 billion road investment program delivering major upgrades across Western Sydney to support population growth and the opening of Western Sydney International Airport in 2026. Key projects include the M12 Motorway (under construction), M4 Smart Motorway, upgrades to The Northern Road and Bringelly Road (largely completed), Werrington Arterial Road (completed 2017), Glenbrook intersection upgrade (completed 2018), and a $200 million Local Roads Package supporting seven Western Sydney councils.
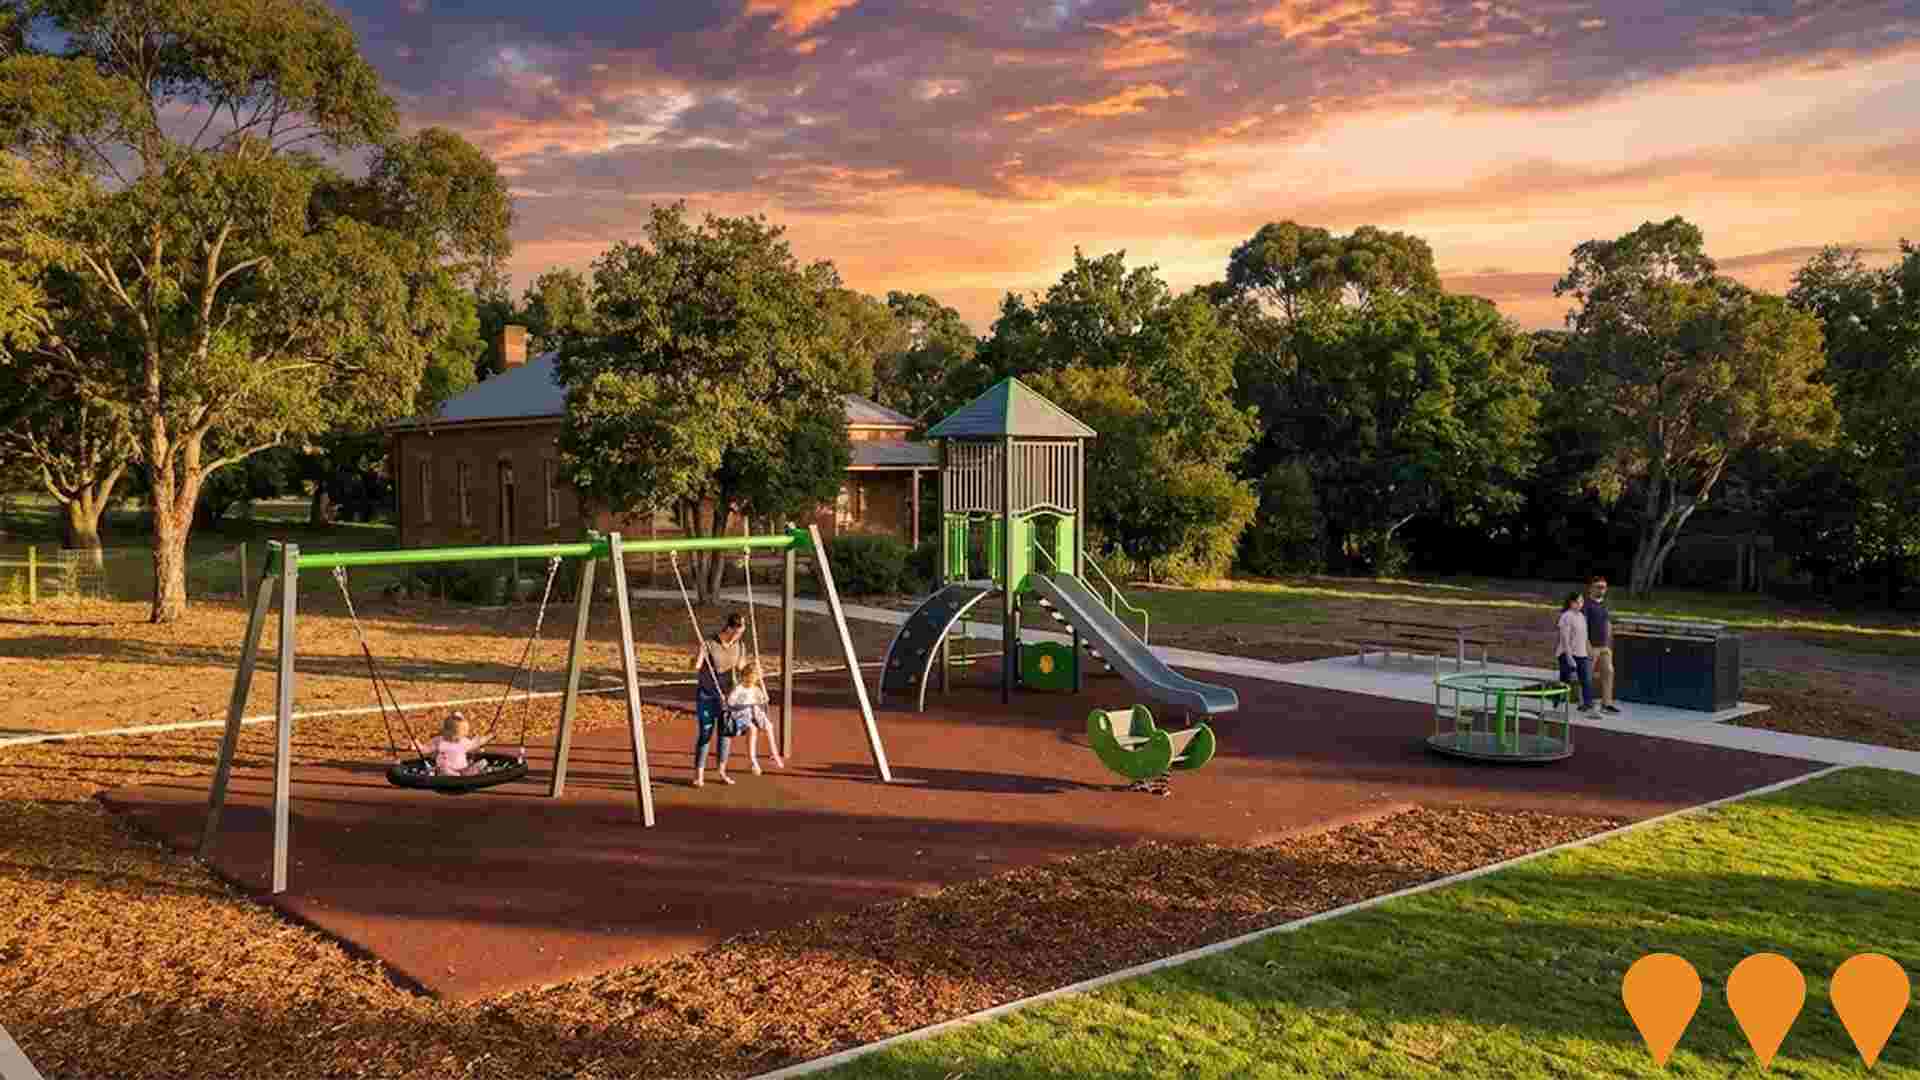
Freemans Reach Reserve - Playground Upgrade
Hawkesbury City Council replaced the older play equipment at Freemans Reach Reserve with a new local playground suitable for children up to 12 years. The upgrade delivers a climbing tower with slide, swings, obstacle course, roundabout, rocker, seating overlooking the sports courts, improved access to tennis courts, a picnic table, bin enclosure, bubbler, new tree planting, landscaping and a walking path. The playground opened in January 2025.
Hambledon Park
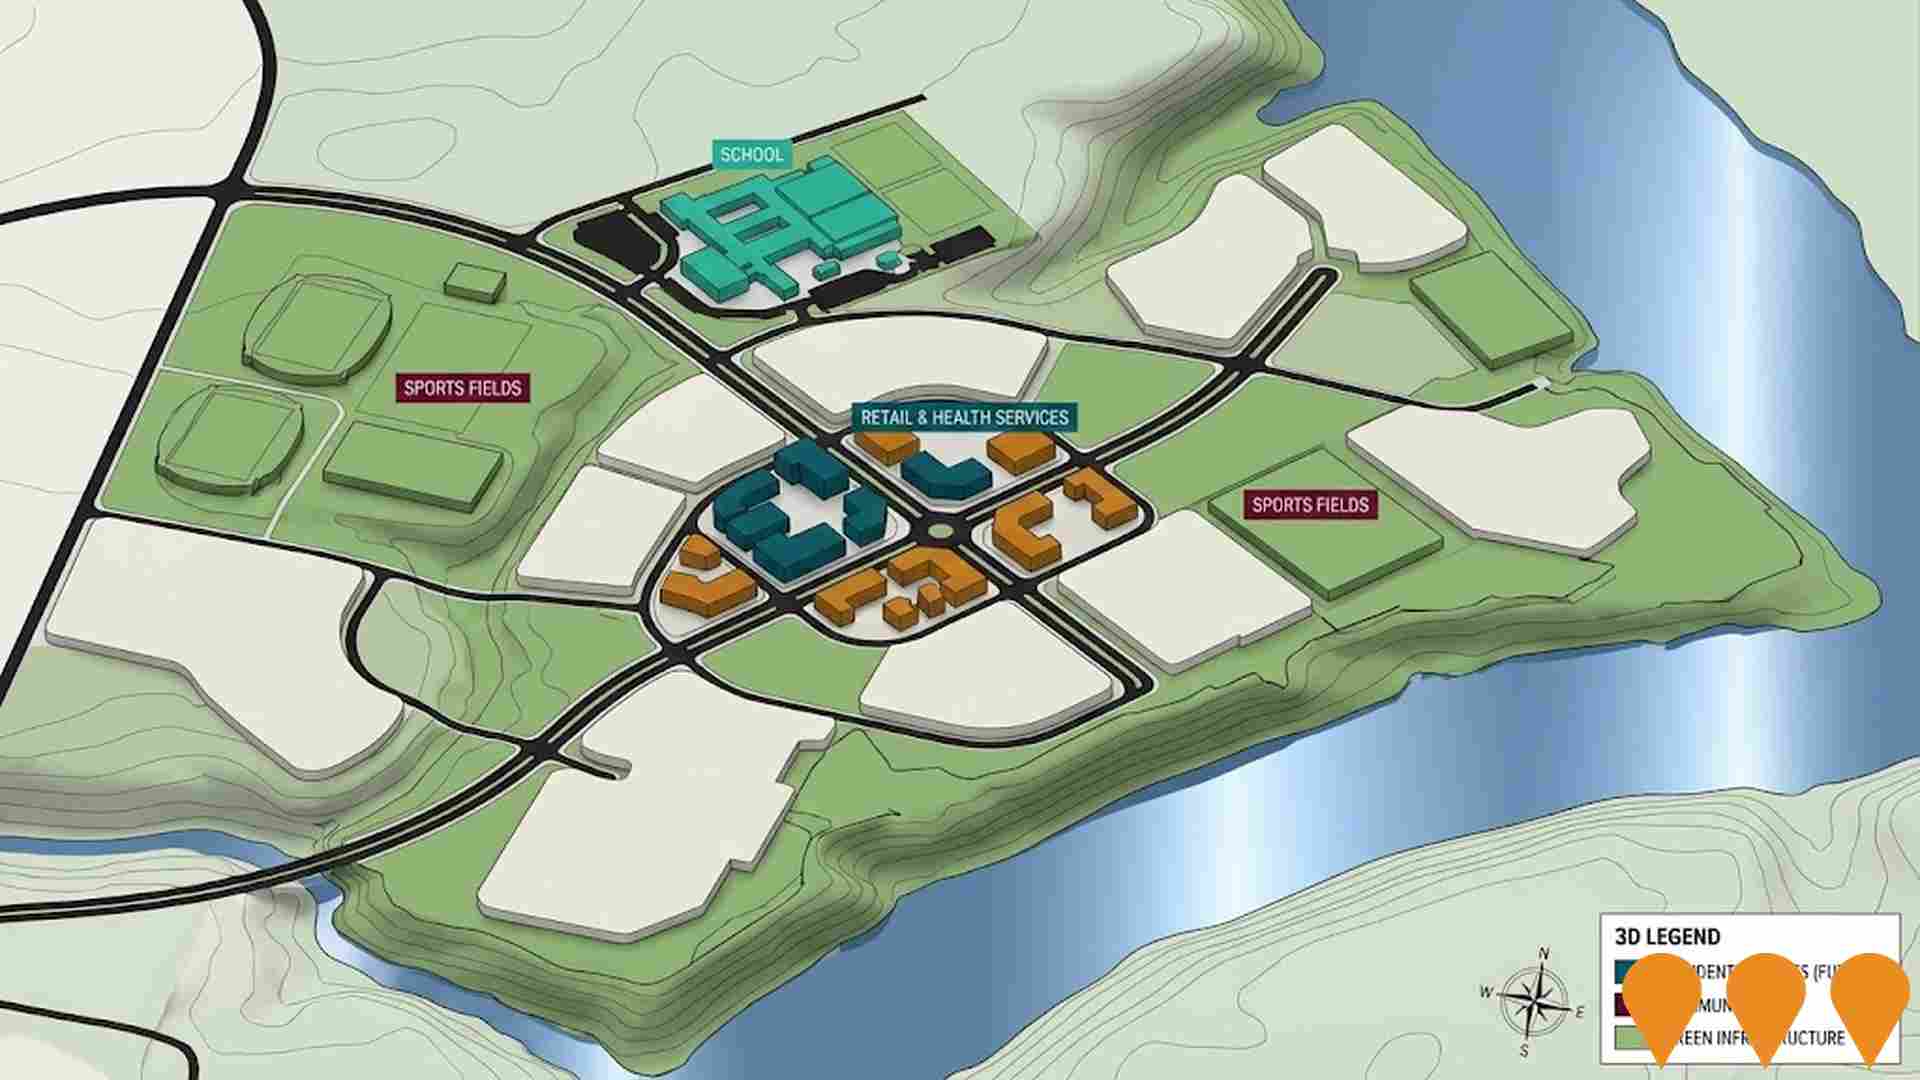
Celestino is in early planning for a large masterplanned community on a ~253 ha site at 393 Terrace Road, North Richmond. As of late 2024/2025 the developer states no formal planning applications have been lodged; they completed early community engagement to inform a forthcoming Scoping Proposal. The vision references a school, health services, retail, sports fields and resilience facilities, but dwelling numbers are not yet determined.
Employment
Employment drivers in Bilpin - Colo - St Albans are experiencing difficulties, placing it among the bottom 20% of areas assessed across Australia
Bilpin-Colo-St Albans has a skilled workforce with the construction sector being notably prominent. The unemployment rate in September 2025 was 6.7%.
At this time, 1,458 residents were employed while the unemployment rate was 2.5% higher than Greater Sydney's rate of 4.2%. Workforce participation was lower at 55.7%, compared to Greater Sydney's 60.0%. Employment is concentrated in construction, health care & social assistance, and education & training. The area specializes in construction employment, with a share 1.8 times the regional level.
Conversely, professional & technical jobs show lower representation at 5.6% versus the regional average of 11.5%. Local employment opportunities appear limited as indicated by Census data comparing working population to resident population. Over a 12-month period ending in September 2025, labour force increased by 0.5% while employment declined by 0.9%, causing unemployment rate to rise by 1.3 percentage points. In contrast, Greater Sydney experienced employment growth of 2.1% and labour force growth of 2.4%. State-level data from NSW to November 25 shows employment contracted by 0.03% (losing 2,260 jobs), with the state unemployment rate at 3.9%, favourable compared to the national rate of 4.3%. Jobs and Skills Australia's national employment forecasts from May-25 indicate potential future demand within Bilpin-Colo-St Albans. These projections suggest national employment will expand by 6.6% over five years and 13.7% over ten years, with industry-specific growth rates varying significantly. Applying these projections to Bilpin-Colo-St Albans's employment mix suggests local employment should increase by 5.9% over five years and 12.5% over ten years.
Frequently Asked Questions - Employment
Income
Income levels align closely with national averages, indicating typical economic conditions for Australian communities according to AreaSearch analysis
The Bilpin - Colo - St Albans SA2 had a median income among taxpayers of $52,146 and an average income of $68,032 in the financial year 2022, according to latest ATO data aggregated by AreaSearch. This compares to Greater Sydney's figures of $56,994 and $80,856 respectively for the same period. Based on Wage Price Index growth of 12.61% since financial year 2022, estimates as of September 2025 would be approximately $58,722 (median) and $76,611 (average). According to 2021 Census figures, household incomes in Bilpin - Colo - St Albans ranked at the 37th percentile, family incomes at the 46th percentile, and personal incomes between the 38th and 45th percentiles. The largest income bracket comprises 32.0% of residents earning $1,500 - 2,999 weekly (902 residents), similar to the broader area where this cohort represents 30.9%. Housing affordability pressures are severe, with only 84.1% of income remaining after housing costs, ranking at the 47th percentile. The area's SEIFA income ranking places it in the 6th decile.
Frequently Asked Questions - Income
Housing
Bilpin - Colo - St Albans is characterized by a predominantly suburban housing profile, with above-average rates of outright home ownership
The dwelling structure in Bilpin - Colo - St Albans, as per the latest Census, consisted of 98.8% houses and 1.2% other dwellings (semi-detached, apartments, 'other' dwellings), compared to Sydney metro's 98.7% houses and 1.2% other dwellings. Home ownership in Bilpin - Colo - St Albans stood at 43.3%, with the remaining dwellings either mortgaged (47.9%) or rented (8.8%). The median monthly mortgage repayment was $2,167, below Sydney metro's average of $2,308. The median weekly rent figure was recorded at $320, compared to Sydney metro's $430. Nationally, Bilpin - Colo - St Albans's mortgage repayments were higher than the Australian average of $1,863, while rents were below the national figure of $375.
Frequently Asked Questions - Housing
Household Composition
Bilpin - Colo - St Albans has a typical household mix, with a lower-than-average median household size
Family households constitute 71.9% of all households, including 31.0% couples with children, 33.9% couples without children, and 6.8% single parent families. Non-family households comprise the remaining 28.1%, with lone person households at 24.9% and group households making up 2.3%. The median household size is 2.5 people, which is smaller than the Greater Sydney average of 2.9.
Frequently Asked Questions - Households
Local Schools & Education
Educational attainment in Bilpin - Colo - St Albans aligns closely with national averages, showing typical qualification patterns and performance metrics
The area's university qualification rate is 23.1%, significantly lower than the SA4 region average of 40.4%. Bachelor degrees are most common at 14.4%, followed by postgraduate qualifications (6.1%) and graduate diplomas (2.6%). Vocational credentials are prevalent, with 45.4% of residents aged 15+ holding them, including advanced diplomas (12.7%) and certificates (32.7%). Educational participation is high at 27.6%, with 10.7% in primary education, 8.5% in secondary education, and 2.7% pursuing tertiary education.
Educational participation is notably high, with 27.6% of residents currently enrolled in formal education. This includes 10.7% in primary education, 8.5% in secondary education, and 2.7% pursuing tertiary education.
Frequently Asked Questions - Education
Schools Detail
Nearby Services & Amenities
Transport
Transport servicing is low compared to other areas nationally based on assessment of service frequency, route connectivity and accessibility
Bilpin-Colo-St Albans region has 122 active public transport stops. These are served by a mix of bus routes totalling 16. The combined weekly passenger trips across these routes is 160.
Transport accessibility in the area is limited, with residents on average located 895 meters from their nearest stop. Service frequency averages 22 trips per day across all routes, resulting in approximately one weekly trip per individual stop.
Frequently Asked Questions - Transport
Transport Stops Detail
Health
Bilpin - Colo - St Albans's residents are healthier than average in comparison to broader Australia with a fairly standard level of common health conditions seen across both young and old age cohorts
Health data shows Bilpin-Colo-St Albans residents have relatively positive health outcomes, with common conditions seen across both young and old age groups.
Private health cover is high at approximately 53% of the total population (~1,505 people). The most prevalent medical conditions are arthritis (8.4%) and asthma (6.9%). Most residents (69.4%) report no medical ailments, slightly lower than Greater Sydney's 70.4%. The area has a higher proportion of seniors aged 65 and over at 24.0% (677 people) compared to Greater Sydney's 18.9%. Health outcomes among seniors are strong, even better than the general population in health metrics.
Frequently Asked Questions - Health
Cultural Diversity
Bilpin - Colo - St Albans ranks below the Australian average when compared to other local markets across a number of language and cultural background related metrics
Bilpin-Colo-St Albans, as per the 2016 Census, showed lower than average cultural diversity with 86.7% of its population being Australian citizens and 84.4% born in Australia. English was spoken at home by 95.0%. Christianity was the predominant religion, practiced by 52.5% of the population.
Judaism, while still a minority, was overrepresented at 0.4%, compared to 0.1% across Greater Sydney. Ancestry-wise, Australian (29.9%), English (29.5%), and Irish (9.3%) were the top three groups. Notably, Dutch (1.9%), Maltese (1.4%), and South African (0.6%) ethnicities had higher representations than regional averages.
Frequently Asked Questions - Diversity
Age
Bilpin - Colo - St Albans hosts an older demographic, ranking in the top quartile nationwide
Bilpin-Colo-St Albans's median age is 48 years, significantly higher than Greater Sydney's average of 37 years and Australia's median age of 38 years. The age profile shows that individuals aged 55-64 years are particularly prominent, making up 18.4% of the population, compared to 8.1% for those aged 25-34 years. This is notably higher than the national average of 11.2% for the 55-64 age group. Between 2021 and present, the 75-84 age group has increased from 7.1% to 9.4%, while the 15-24 cohort has grown from 9.8% to 11.1%. Conversely, the 5-14 age group has declined from 10.9% to 9.5%, and the 45-54 age group has decreased from 16.5% to 15.1%. Population forecasts for 2041 indicate substantial demographic changes in Bilpin-Colo-St Albans, with the strongest growth projected for the 85+ cohort (209%), adding 123 residents to reach 182 individuals. Senior residents aged 65 and above will drive all population growth, reflecting ongoing demographic aging trends. Conversely, population declines are forecasted for the 0-4 and 25-34 age cohorts.
