Chart Color Schemes
This analysis uses ABS Statistical Areas Level 2 (SA2) boundaries, which can materially differ from Suburbs and Localities (SAL) even when sharing similar names.
SA2 boundaries are defined by the Australian Bureau of Statistics and are designed to represent communities for statistical reporting (e.g., census and ERP).
Suburbs and Localities (SAL) represent commonly-used suburb/locality names (postal-style areas) and may use different geographic boundaries. For comprehensive analysis, consider reviewing both boundary types if available.
est. as @ -- *
ABS ERP | -- people | --
2021 Census | -- people
Sales Activity
Curious about local property values? Filter the chart to assess the volume and appreciation (including resales) trends and regional comparisons, or scroll to the map below view this information at an individual property level.
Find a Recent Sale
Sales Detail
Population
Population growth drivers in Mount Johns are above average based on AreaSearch's ranking of recent, and medium to long-term trends
Mount Johns's population is around 4,785 as of Nov 2025. This reflects an increase of 760 people since the 2021 Census, which reported a population of 4,025 people. The change is inferred from the estimated resident population of 4,776 from the ABS as of June 2024 and an additional 8 validated new addresses since the Census date. This level of population equates to a density ratio of 252 persons per square kilometer. Mount Johns's 18.9% growth since the 2021 census exceeded the national average (8.9%), along with the state, marking it as a growth leader in the region. Population growth for the area was primarily driven by overseas migration that contributed approximately 76.7% of overall population gains during recent periods.
AreaSearch is adopting ABS/Geoscience Australia projections for each SA2 area, as released in 2024 with 2022 as the base year. For any SA2 areas not covered by this data, and to estimate growth across all areas in the years post-2032, AreaSearch is applying growth rates by age cohort to each area, as provided by the ABS in its latest Greater Capital Region projections (released in 2023, based on 2022 data). As we examine future population trends, an above median population growth of regional areas nationally is projected. The area is expected to expand by 1,066 persons to 2041 based on the latest annual ERP population numbers, reflecting an increase of 22.1% in total over the 17 years.
Frequently Asked Questions - Population
Development
Residential development activity is lower than average in Mount Johns according to AreaSearch's national comparison of local real estate markets
Mount Johns has seen approximately 10 new homes approved each year over the past five financial years, totalling 53 homes. As of FY-26, 8 approvals have been recorded. On average, around 10.8 new residents arrive per dwelling constructed annually between FY-21 and FY-25. This indicates a significant demand exceeding supply, which typically leads to price growth and increased buyer competition.
The average construction value for new dwellings is $181,000, lower than regional levels, suggesting more affordable housing options. In FY-26, there have been $22.5 million in commercial approvals, showing moderate commercial development activity. Compared to the Rest of NT, Mount Johns exhibits moderately higher construction activity, with 47.0% above the regional average per person over five years. This maintains reasonable buyer options while sustaining existing property demand. However, recent periods have seen a moderation in development activity, which is also below national averages, suggesting possible planning constraints and area maturity. Recent construction comprises 14.0% standalone homes and 86.0% townhouses or apartments, indicating a shift towards higher-density living to accommodate downsizers, investors, and first-home buyers.
This marks a significant change from the current housing mix of 45.0% houses, reflecting reduced development site availability and evolving lifestyle demands. The estimated population per dwelling approval is 3551 people, reflecting Mount Johns' quiet, low activity development environment. According to AreaSearch's latest quarterly estimate, Mount Johns is expected to grow by 1,057 residents through to 2041. If current construction levels persist, housing supply may lag population growth, potentially intensifying buyer competition and supporting price growth.
Frequently Asked Questions - Development
Infrastructure
Mount Johns has limited levels of nearby infrastructure activity, ranking in the 3rdth percentile nationally
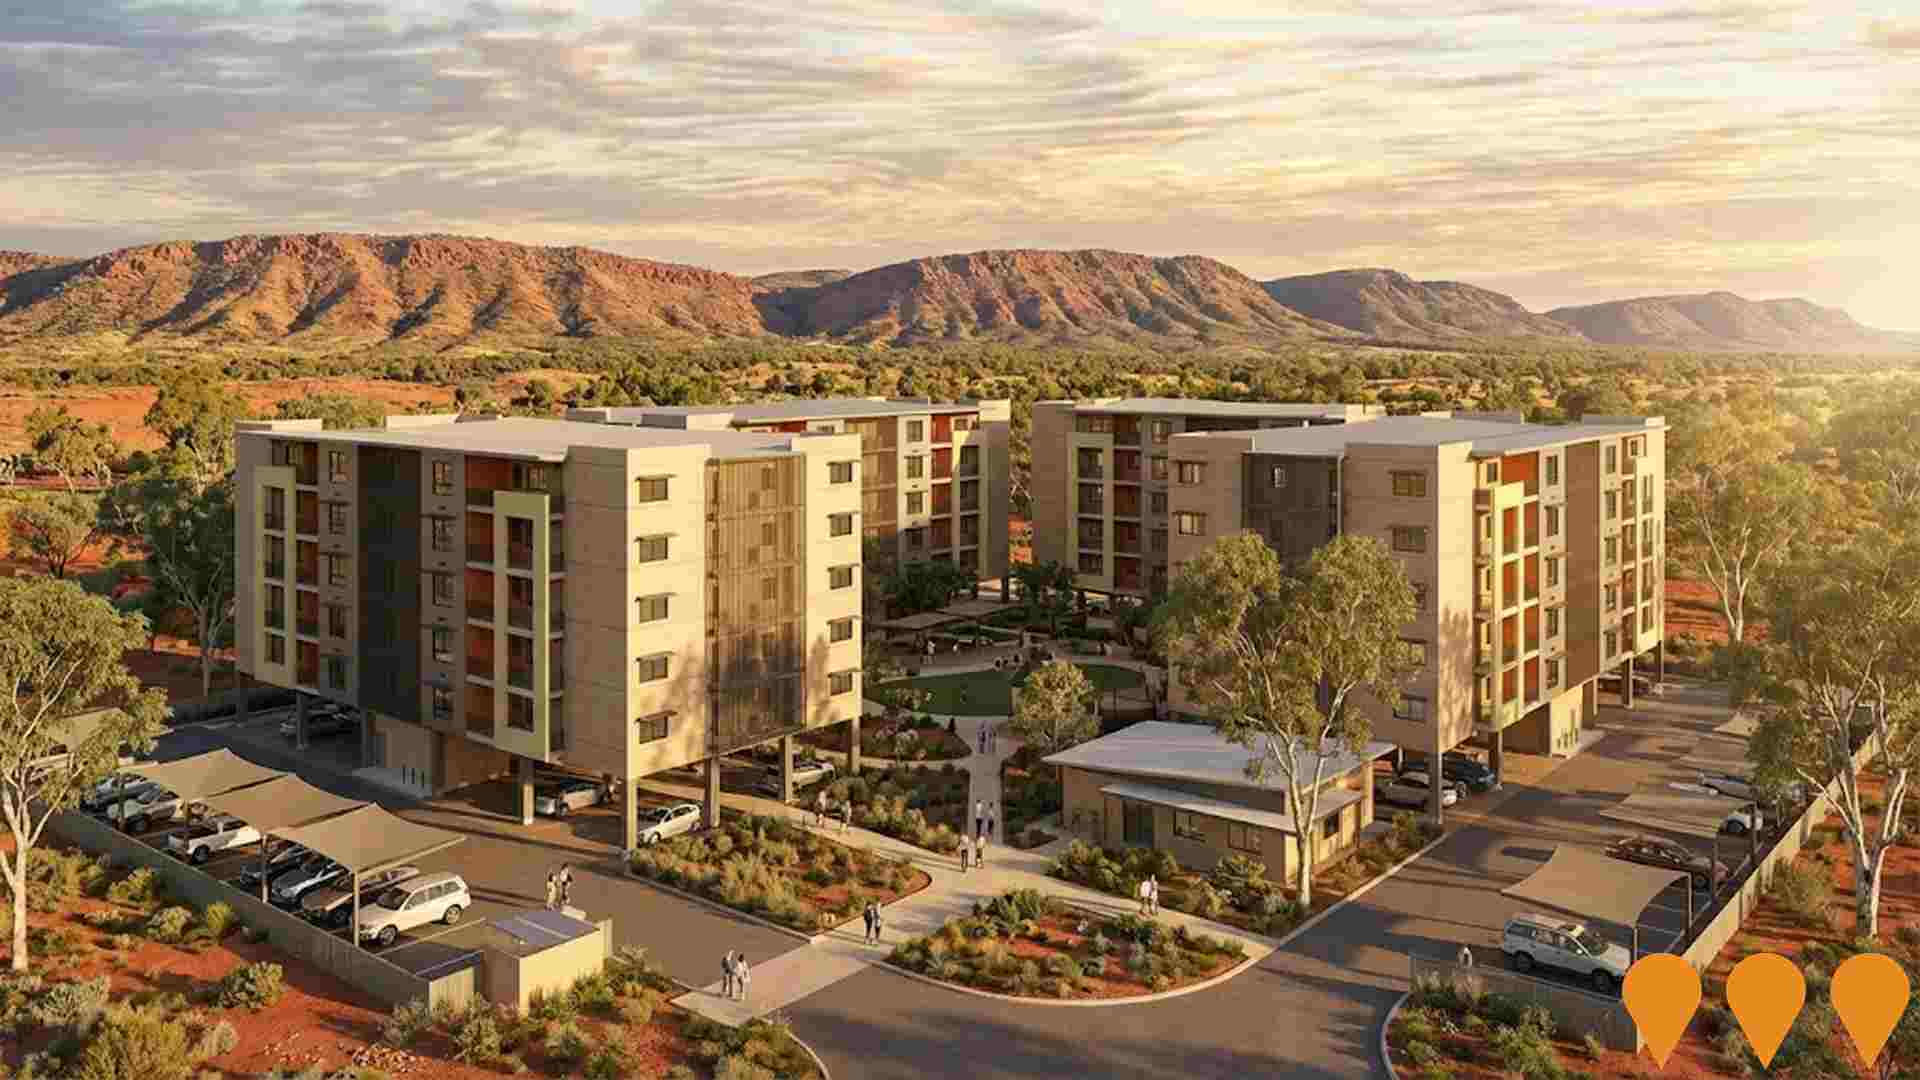
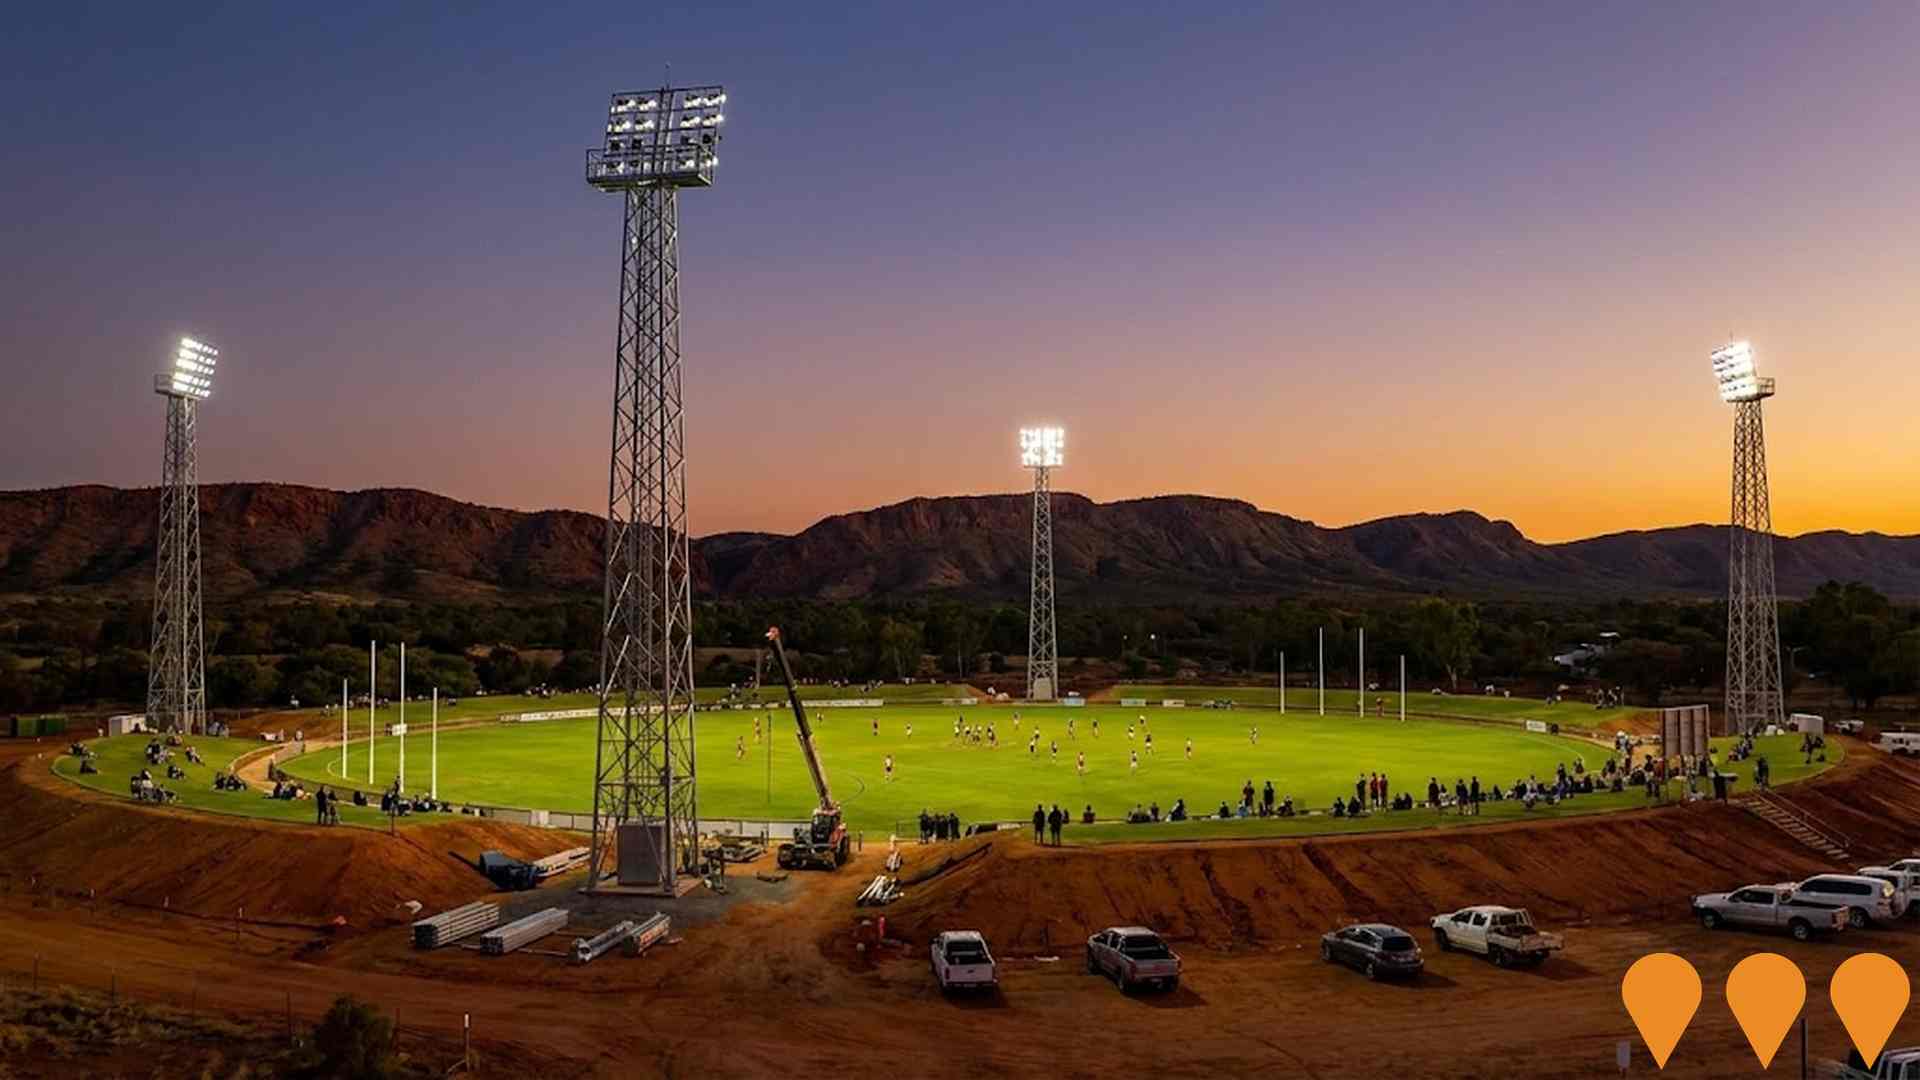
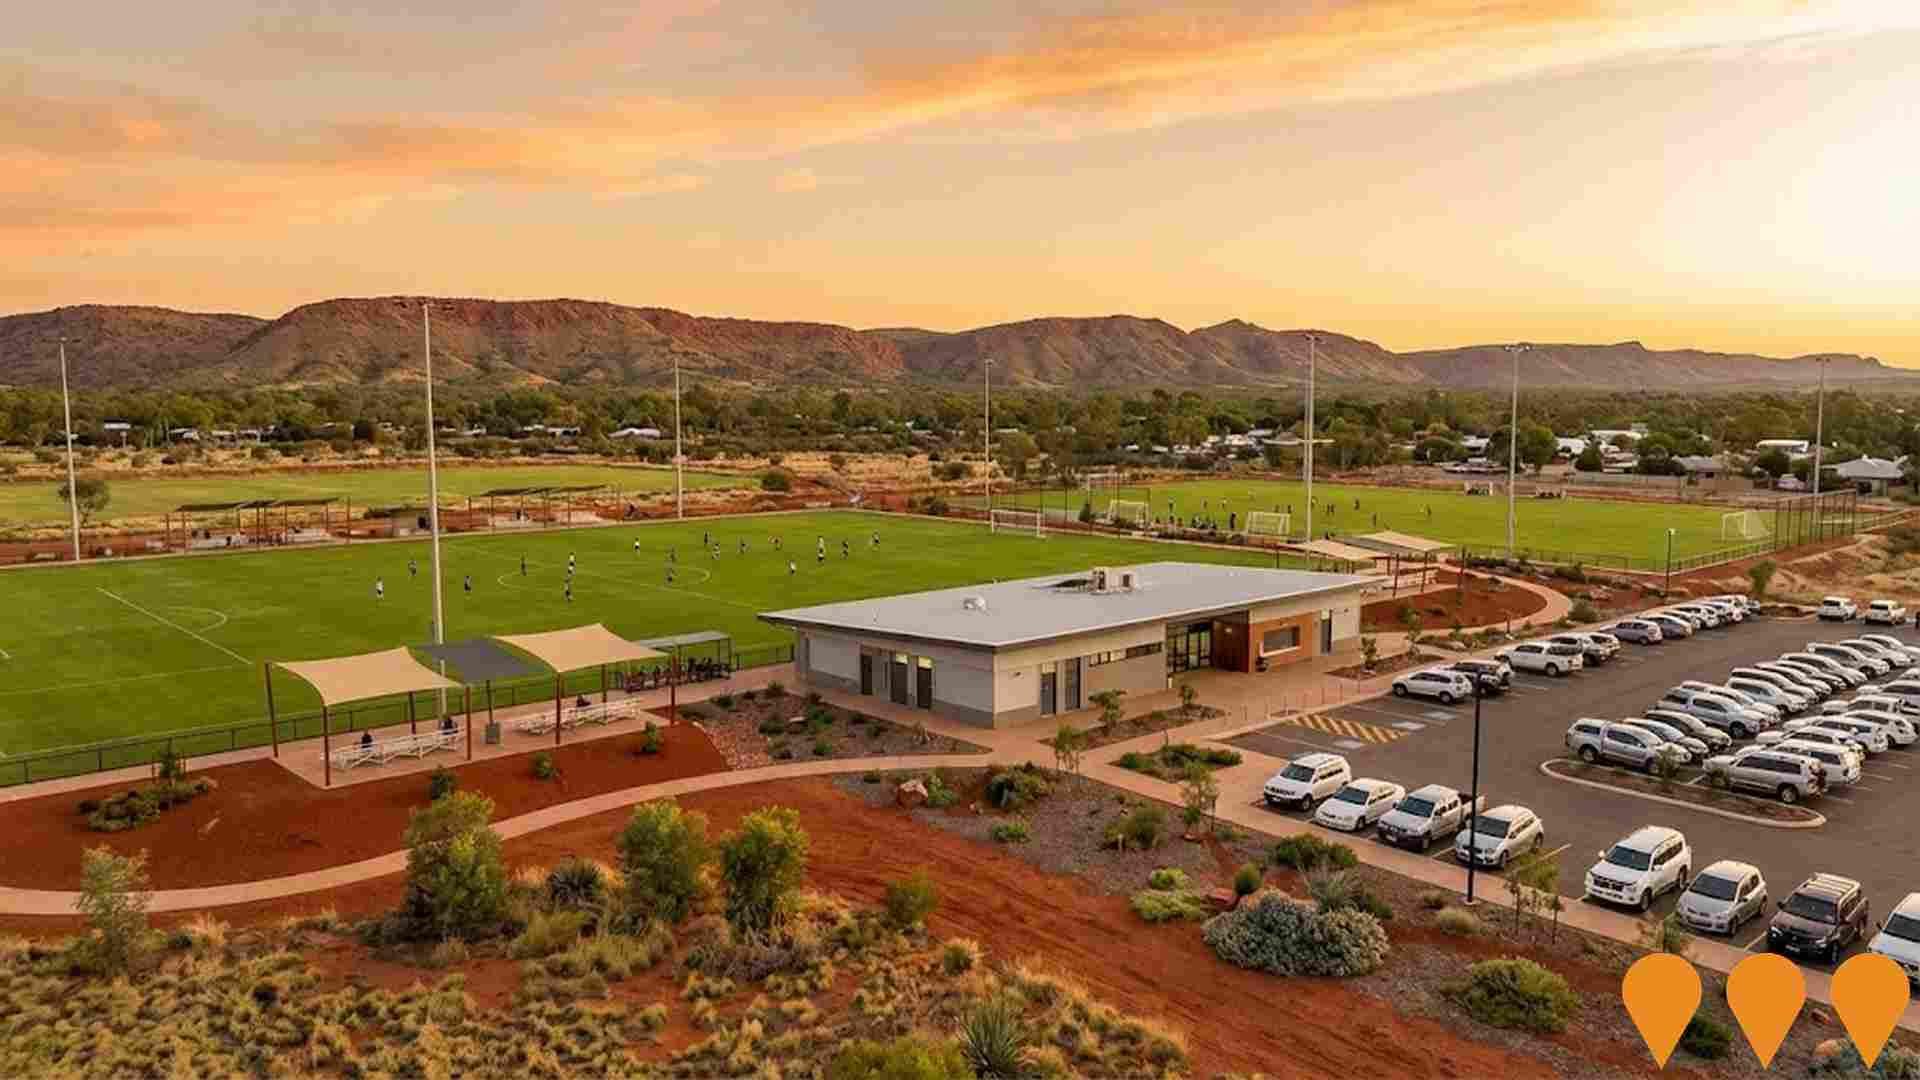
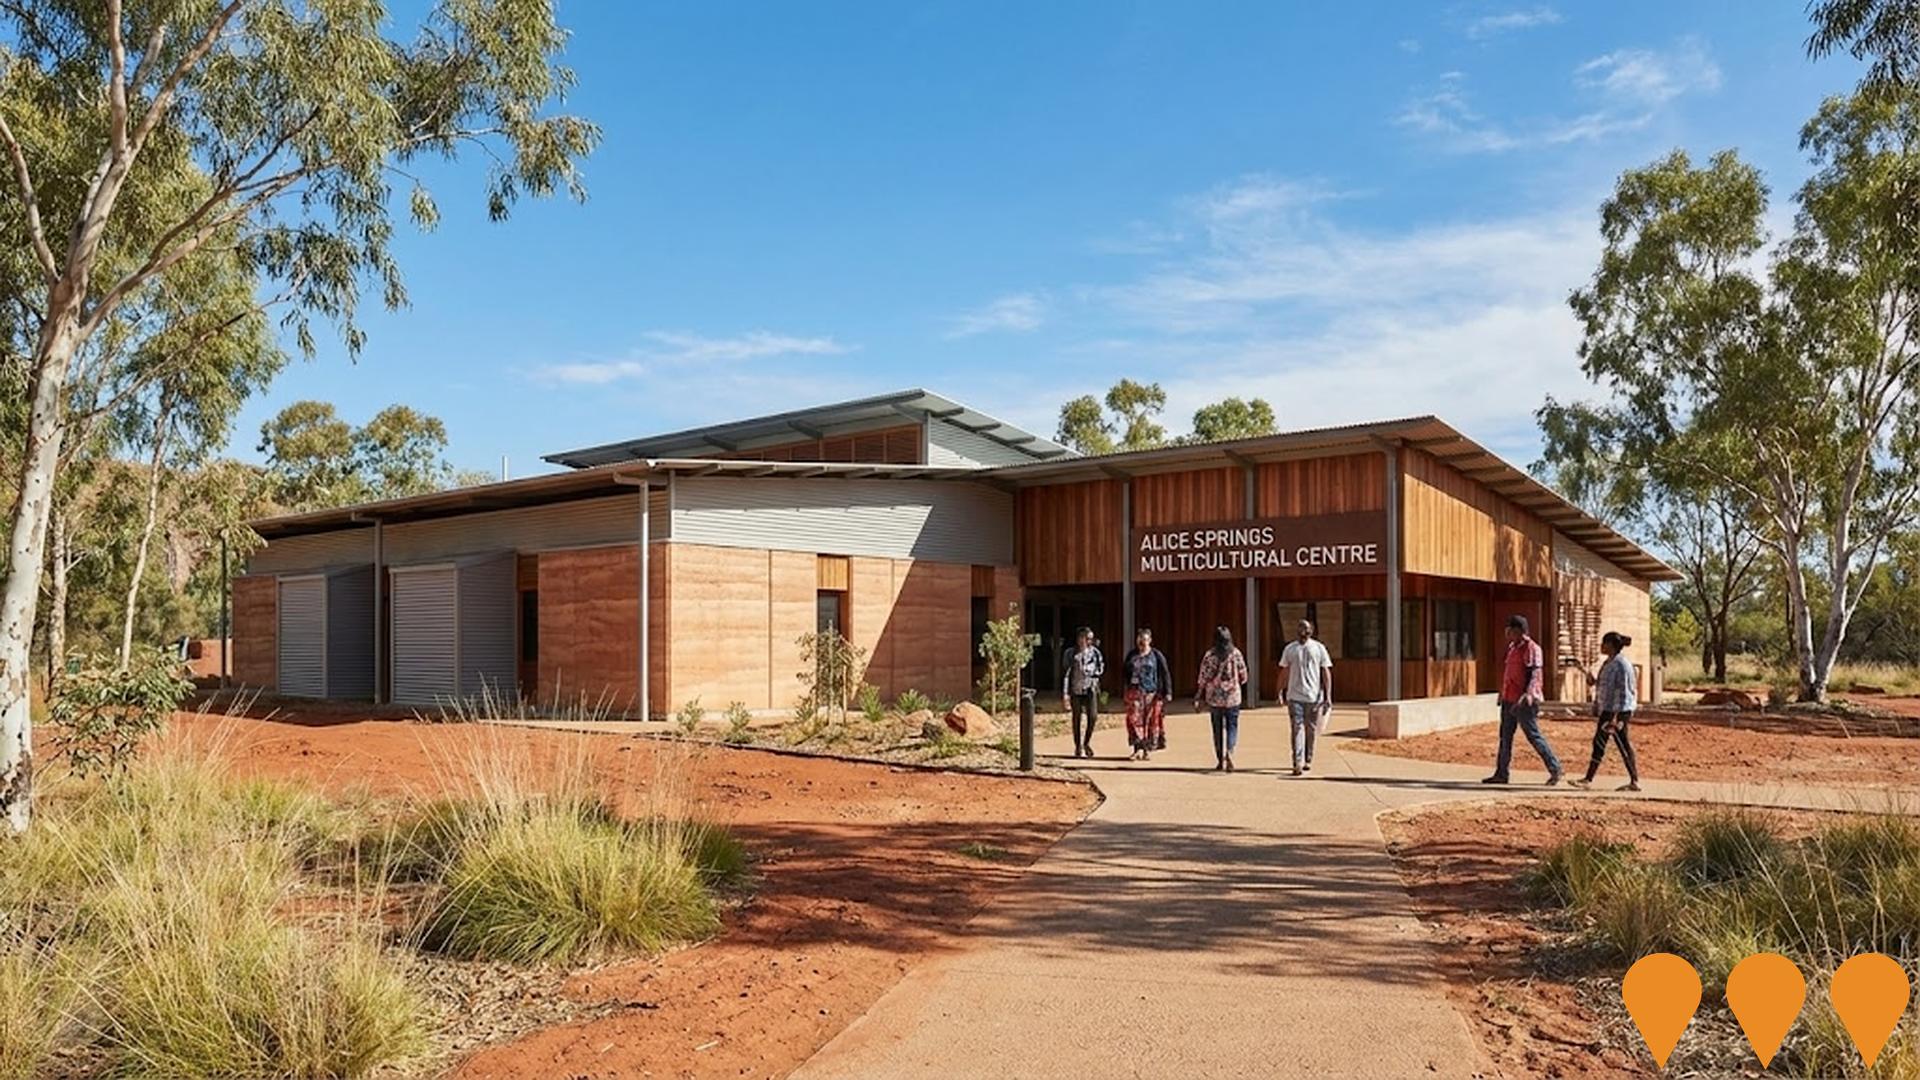
The performance of an area can significantly be influenced by changes in local infrastructure, major projects, and planning initiatives. AreaSearch has identified a total of 15 projects that are likely to impact the area. Notable projects include the Melanka Accelerated Accommodation Development, St Mary's Hostel Social and Affordable Housing Project, Lasseters Hotel Casino Extension And Redevelopment, and Aboriginal and Torres Strait Islander Art Gallery of Australia. The following list details those projects most likely to be relevant.
Professional plan users can use the search below to filter and access additional projects.
INFRASTRUCTURE SEARCH
 Denotes AI-based impression for illustrative purposes only, not to be taken as definitive under any circumstances. Please follow links and conduct other investigations from the project's source for actual imagery. Developers and project owners wishing us to use original imagery please Contact Us and we will do so.
Frequently Asked Questions - Infrastructure
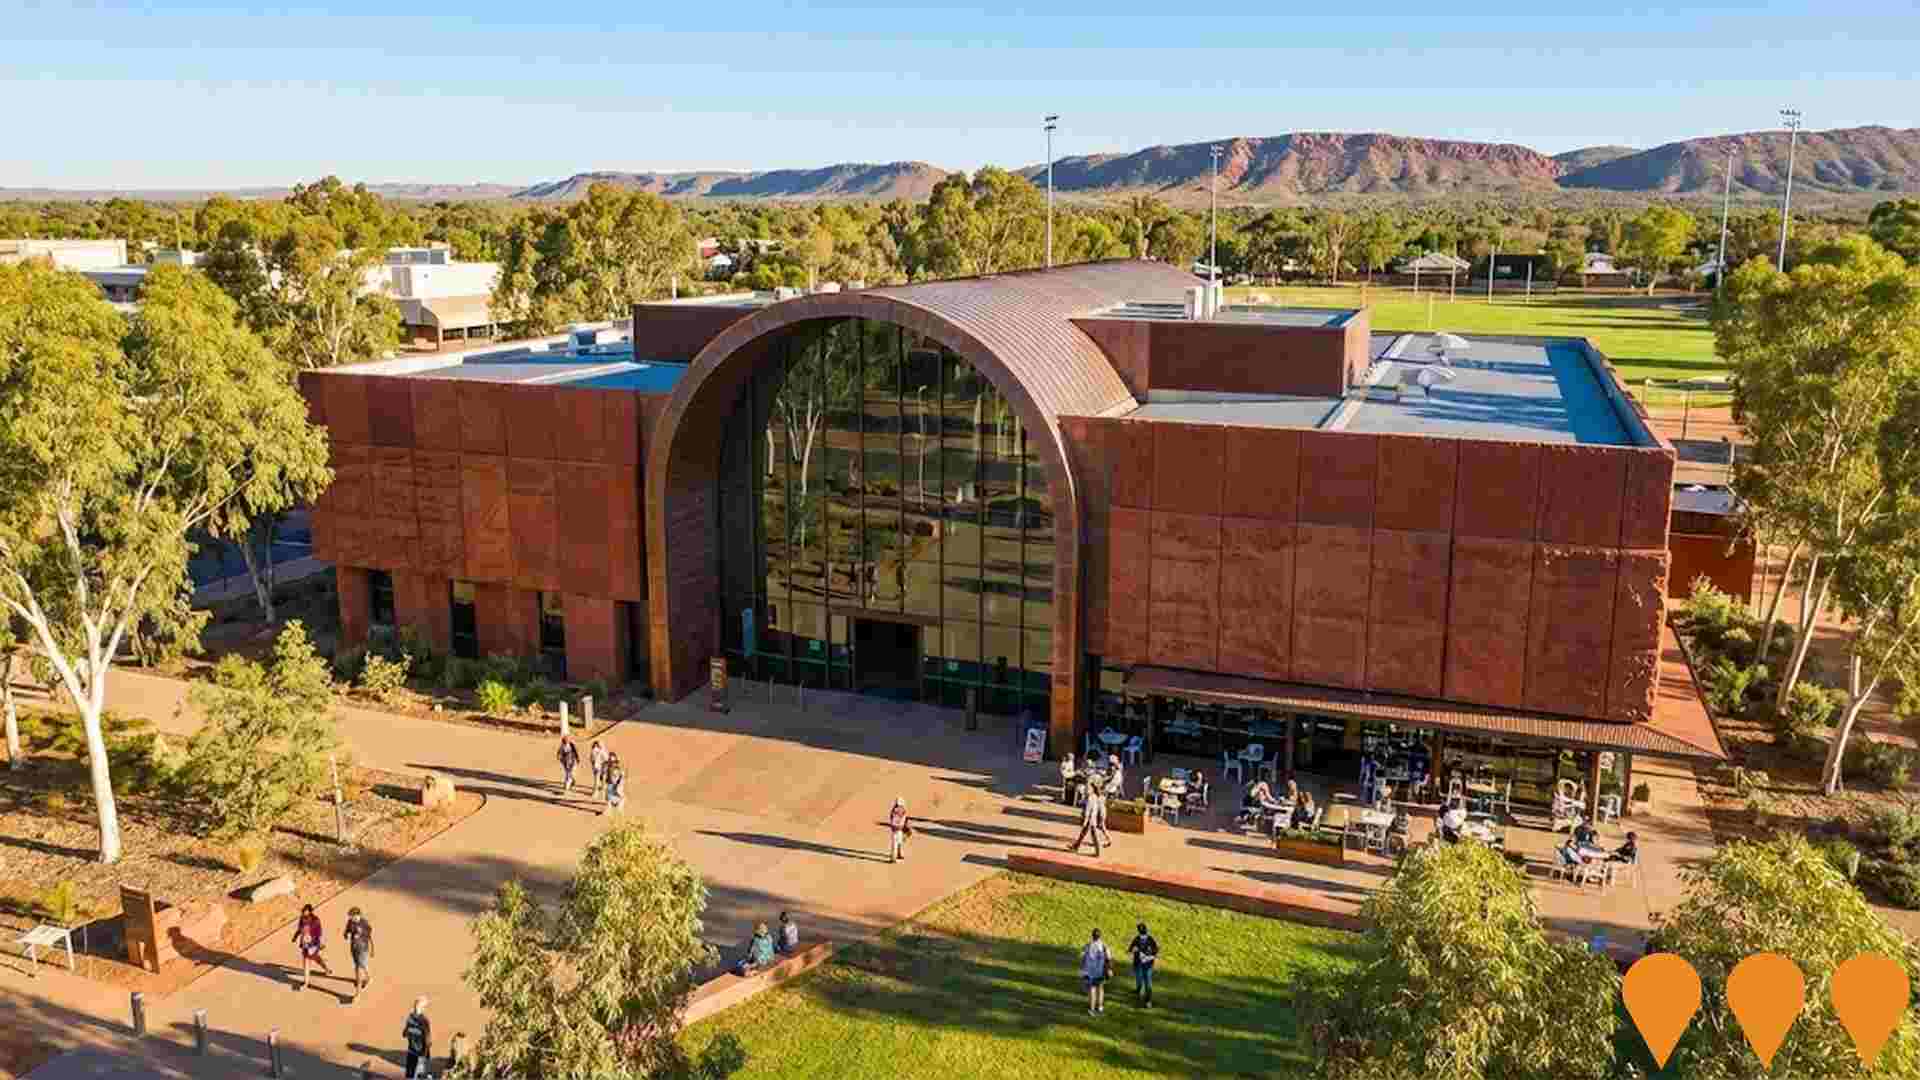
Aboriginal and Torres Strait Islander Art Gallery of Australia
A world-class national gallery celebrating the artistic traditions and cultural expressions of Australia's Aboriginal and Torres Strait Islander peoples. The revised design features a 3-storey, 4,000 square meter building with over 1,300 square meters of exhibition space for major touring and international exhibitions. Located in the heart of Alice Springs CBD on the southern portion of the Anzac Oval precinct at the Wills Terrace car park site. The gallery will include a public cafe, community forecourt with seating and landscaping, secure loading dock, art quarantine and conservation spaces, and staff facilities. Design reached 50% completion in July 2025 with development consent application submitted. The project aims to showcase First Nations art from the birthplace of contemporary Aboriginal art, Mparntwe (Alice Springs), driving cultural tourism and economic growth. Not a collecting gallery but focused on exhibitions and celebrating Aboriginal and Torres Strait Islander arts.
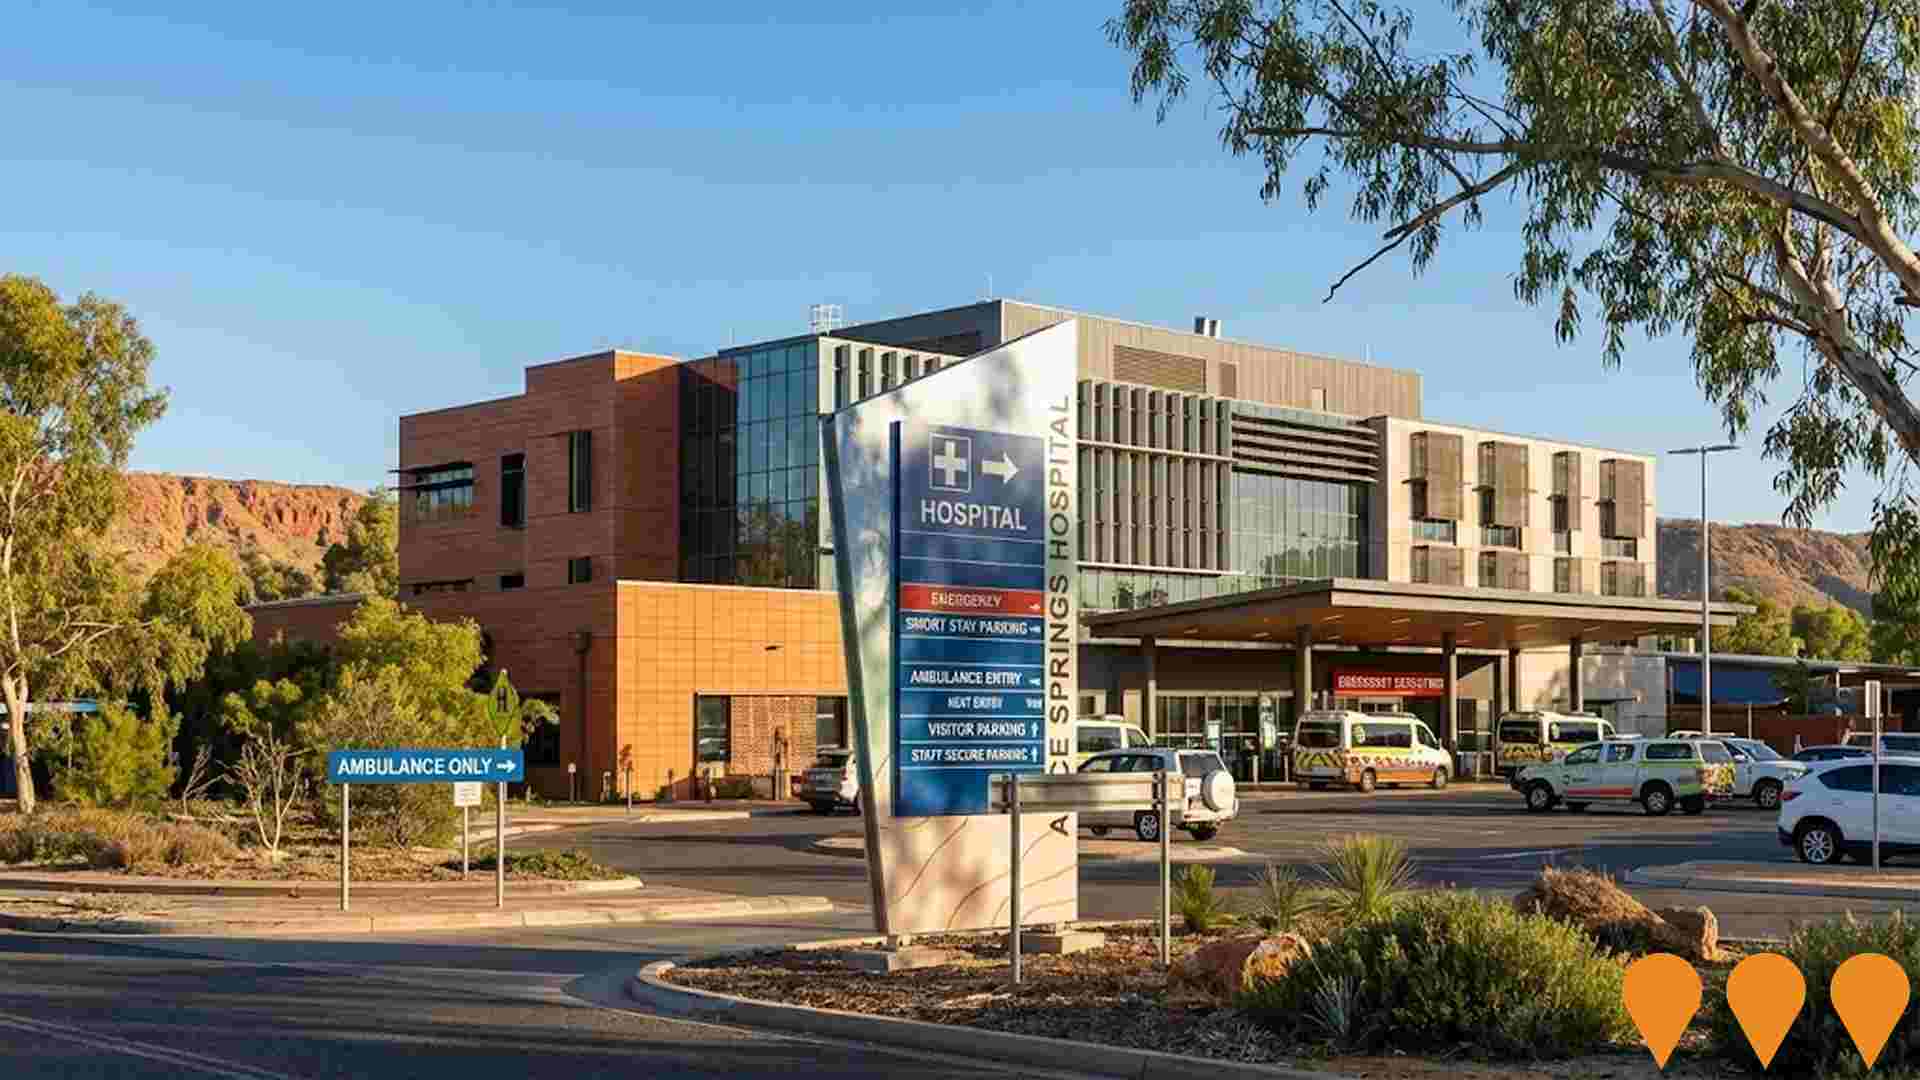
Alice Springs Hospital Emergency Department Redevelopment
Major redevelopment and expansion of the Alice Springs Hospital Emergency Department to deliver a larger, modern facility with increased treatment spaces, dedicated paediatric area, fast-track zone, and improved resuscitation capabilities for Central Australia's primary acute care hospital.
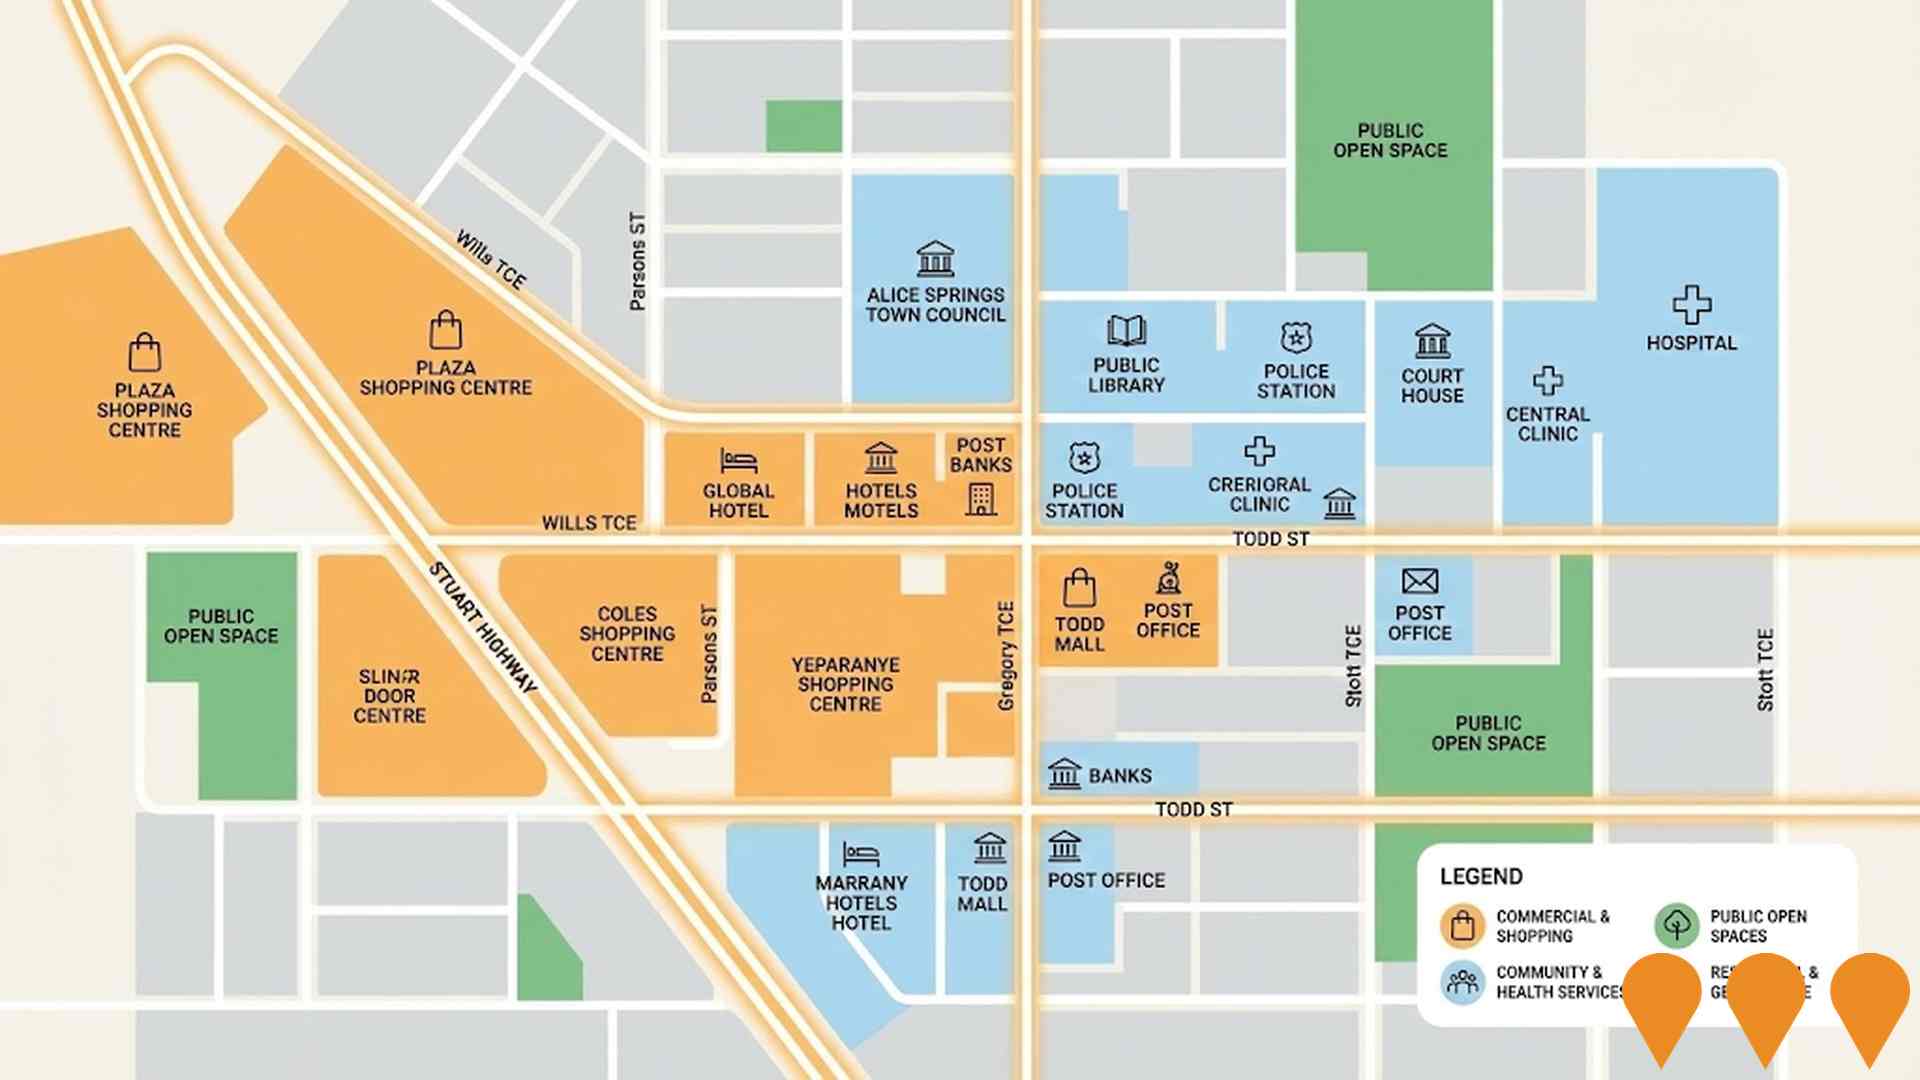
Central Alice Springs Area Plan
The Central Alice Springs Area Plan was finalised in 2021 and is now an active planning policy document under the Northern Territory Planning Scheme. It provides detailed land-use guidance and zoning for the central business district and surrounding precincts, supporting commercial, medical, tourism, cultural and residential development in Alice Springs.
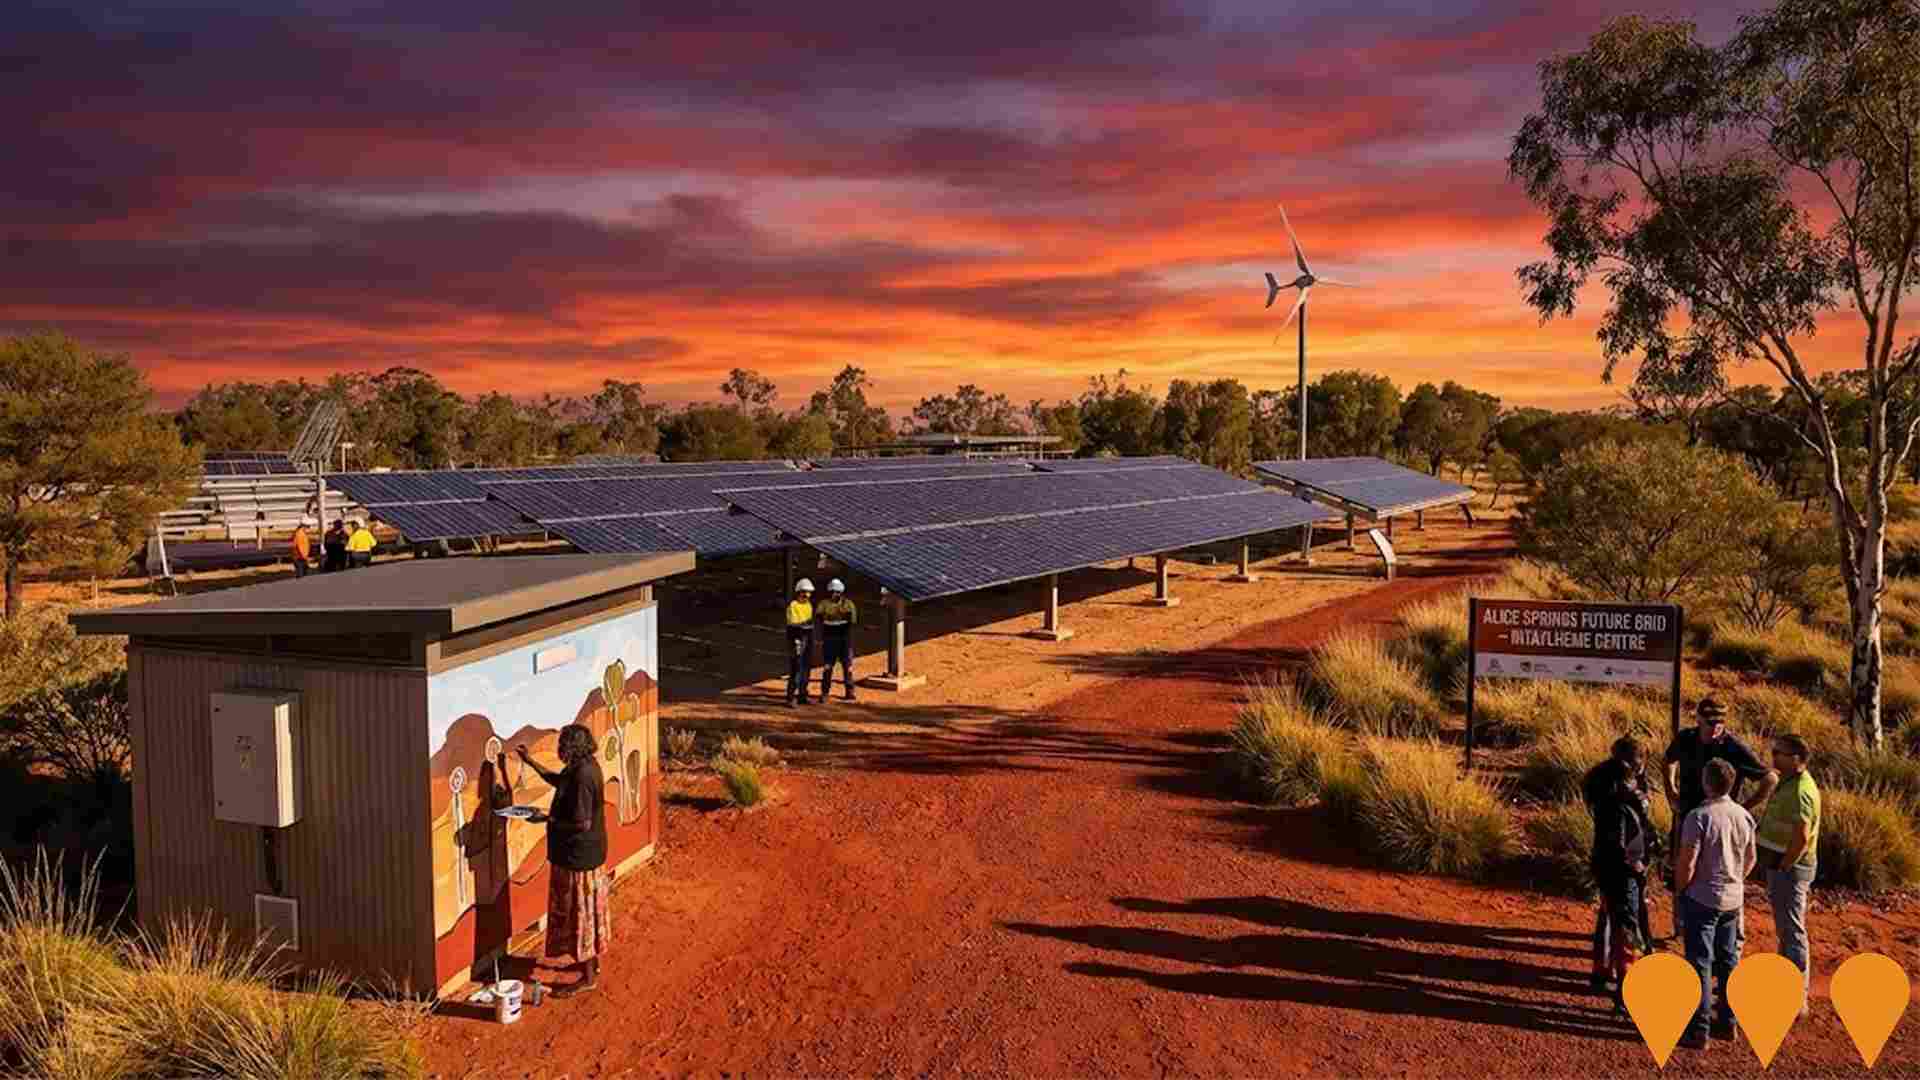
Alice Springs Future Grid - Roadmap to 2030
Three year whole of system initiative led by the Intyalheme Centre for Future Energy (a Desert Knowledge Australia project) to identify and remove barriers to achieving 50% renewable generation in Alice Springs by 2030. Concluded in 2024 with the Roadmap to 2030 and a suite of final reports after trials including a virtual power plant, an islandable microgrid at the Desert Knowledge Precinct, public housing solar and battery trial, and wind resource monitoring.
Alice Springs Flood Mitigation Project
Major flood mitigation infrastructure project to reduce flooding impacts in Alice Springs through trunk drainage upgrades. Engineering feasibility assessment underway to inform concept design of key trunk drainage infrastructure to mitigate flooding from the Todd River and localized stormwater overflows. The project focuses on structural flood mitigation measures including upgrades to major drainage infrastructure and is expected to reduce flooding impacts on 386 properties, providing flood immunity for public roads and improved protection for residential areas in localised flooding events up to a 1 in 100 year event.

Alice Springs CBD Revitalisation Project
Northern Territory Government program to transform the Alice Springs CBD into a greener, cooler and safer town centre through shade structures and tree planting, lighting and CCTV upgrades including Billy Goat Hill, wayfinding, traffic calming and streetscape works. A River Activation Space opened in February 2022. Final road reseal and line marking works occurred April-May 2024 with the project marked complete in July 2024.

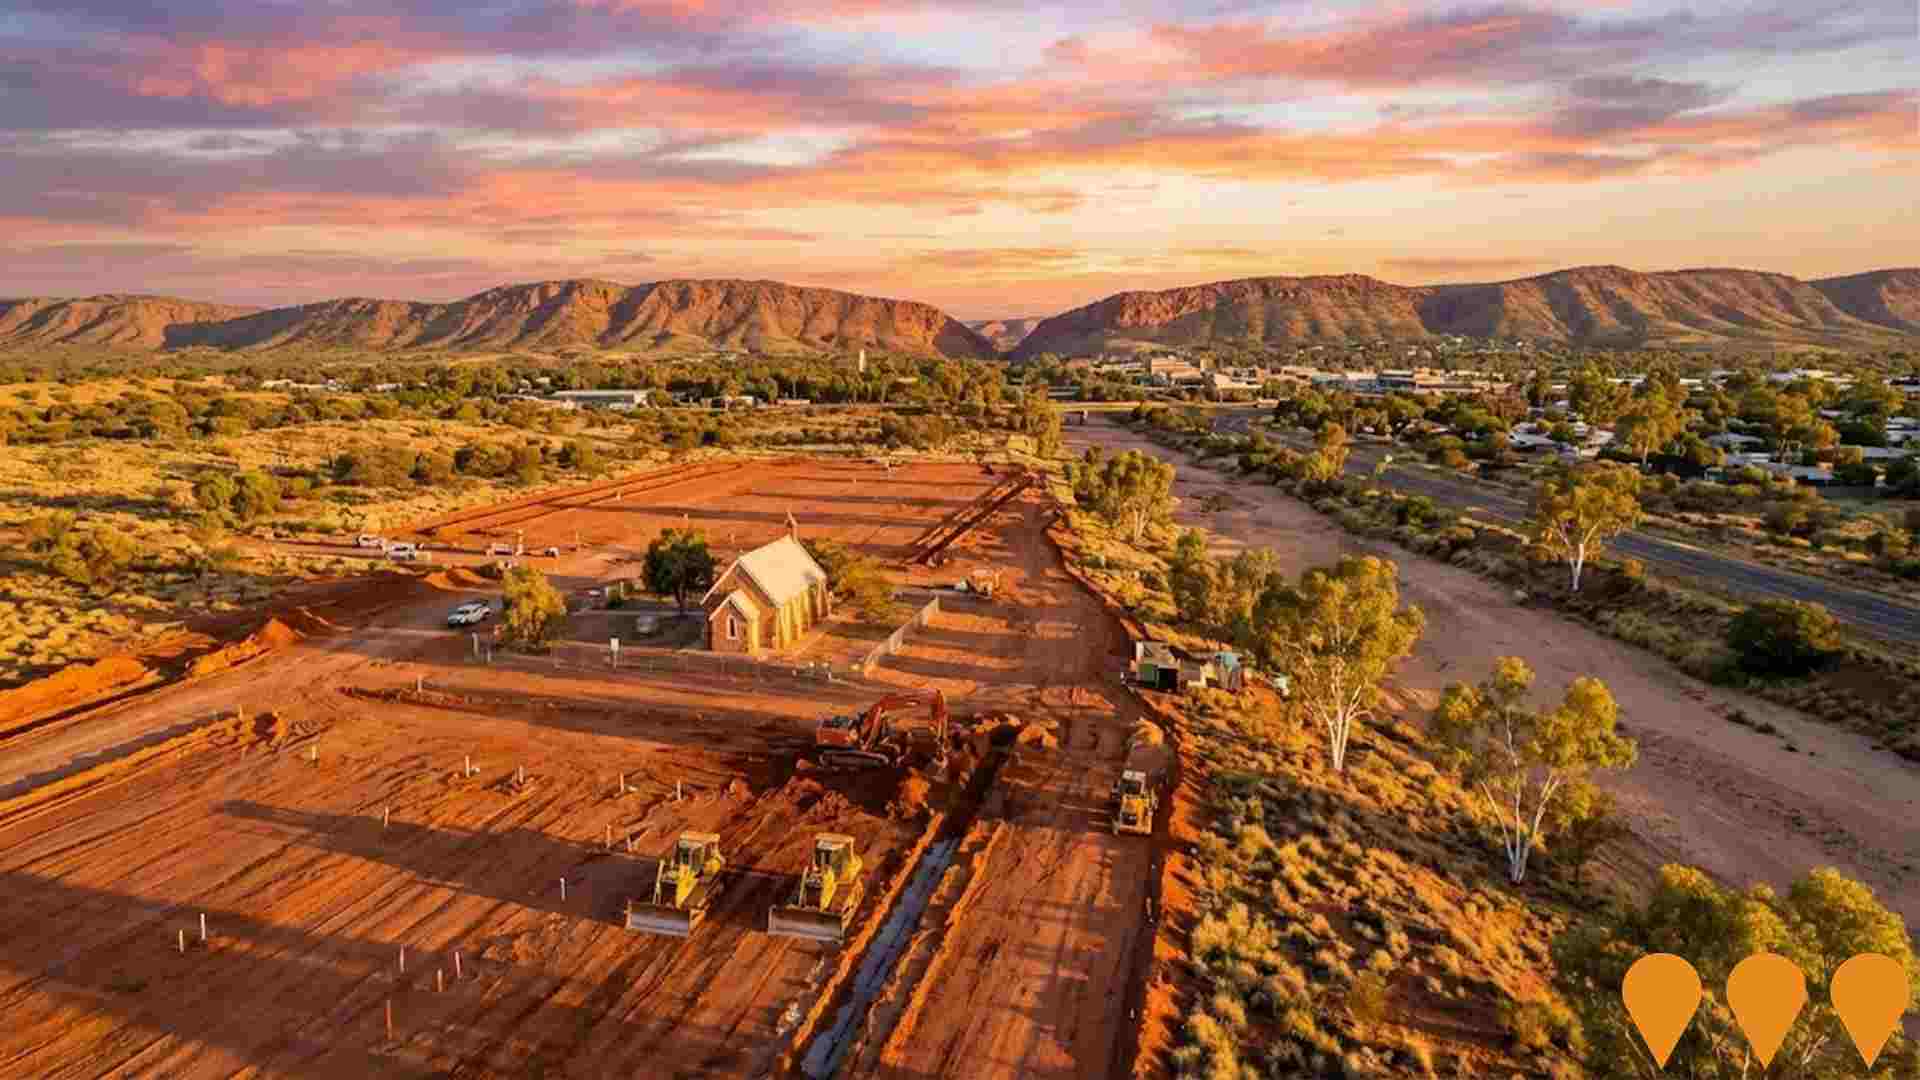
St Mary's Hostel Social and Affordable Housing Project
Redevelopment of the historic 8.2-hectare St Mary's Hostel site to deliver up to 120 social and affordable dwellings. The project, backed by $14 million in Australian Government funding for enabling infrastructure and site works, will honor the site's historical, cultural, and heritage significance through the preservation of the St Mary's Chapel and its heritage-listed mural, and community access for events. The site was acquired by the Northern Territory Government in early 2024 for $3.25 million, but there are no immediate plans for full redevelopment, with initial efforts focused on preservation, land studies, and consultation with the St Mary's Stolen Generation Group.
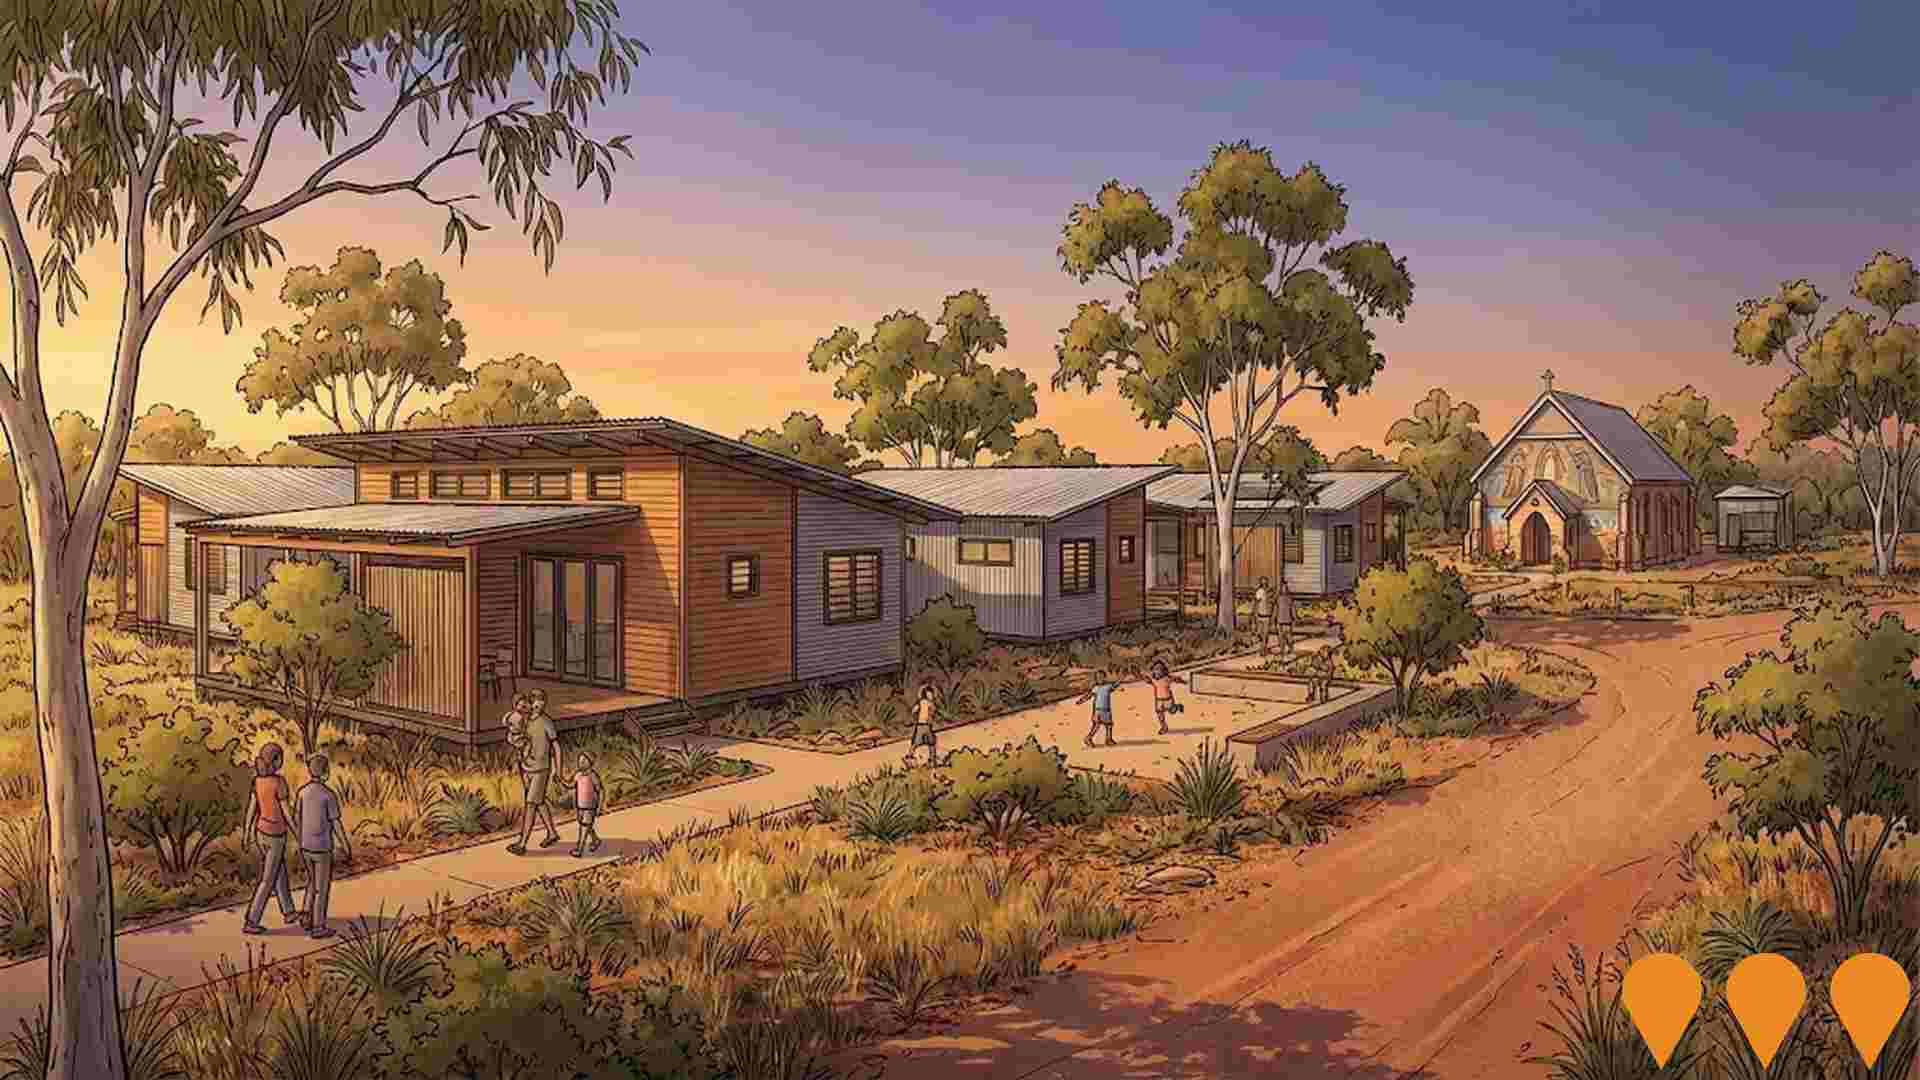
St Mary's Land Development
The NT Government acquired the historic 8.2-hectare St Mary's site in March 2024 for $3.25 million to develop up to 120 social and affordable housing dwellings. The Australian Government has committed $14 million for enabling infrastructure including power, water, sewerage, roads, site preparation, demolition and remediation. The development will preserve the heritage-listed St Mary's Chapel with its 1958 Robert Czako mural and other sites of cultural significance important to the Stolen Generations. The site, located on the Stuart Highway alongside the Todd River south of Heavitree Gap, operated as a boarding school for mainly Aboriginal children from 1947 to 1972. While there are no immediate plans for construction, the project is part of the Housing Australia Future Fund and National Infrastructure Facility programs, with the NT Government working closely with the St Mary's Stolen Generation Group to ensure development honors the legacy of former residents.
Employment
Employment conditions in Mount Johns rank among the top 10% of areas assessed nationally
Mount Johns has an educated workforce with significant representation in essential services sectors. Its unemployment rate is 0.7% as of September 2025.
The area employs 4,051 residents while its unemployment rate is 5.2% lower than the Rest of NT's rate of 5.9%. Workforce participation stands at 75.3%, higher than the Rest of NT's 50.7%. Key employment sectors include health care & social assistance, public administration & safety, and retail trade. Notably, health care & social assistance has an employment share 1.5 times the regional level.
Conversely, agriculture, forestry & fishing has limited presence with just 0.1% of employment compared to the regional average of 5.0%. The worker-to-resident ratio is 0.6, indicating a higher-than-average level of local employment opportunities. Between September 2024 and September 2025, labour force levels decreased by 0.9%, with employment declining by the same percentage, keeping unemployment relatively stable at around 1%. In contrast, Rest of NT saw an employment decline of 1.3% and a marginal rise in unemployment. Jobs and Skills Australia's national employment forecasts from May-25 project overall employment growth of 6.6% over five years and 13.7% over ten years. However, applying these projections to Mount Johns' employment mix suggests local employment should increase by 7.4% over five years and 15.4% over ten years.
Frequently Asked Questions - Employment
Income
The economic profile demonstrates exceptional strength, placing the area among the top 10% nationally based on comprehensive AreaSearch income analysis
The median taxpayer income in Mount Johns SA2 was $74,334 with an average of $83,211 according to AreaSearch's aggregation of postcode level ATO data for the financial year 2022. This is significantly higher than the national median income of $51,655 and average income of $61,577 in Rest of NT. By September 2025, estimated median income would be approximately $83,262 and average income $93,205 based on a 12.01% Wage Price Index growth since financial year 2022. In the 2021 Census, Mount Johns ranked between the 82nd and 94th percentiles nationally for household, family and personal incomes. Income brackets showed that 38.4% of residents (1,837 individuals) earned within the $1,500 - 2,999 range, similar to the broader area's 33.6%. A substantial proportion of high earners (33.8%) indicated strong economic capacity in this suburb. Housing expenses accounted for 14.9% of income while residents ranked within the 83rd percentile for disposable income. The area's SEIFA income ranking placed it in the 7th decile.
Frequently Asked Questions - Income
Housing
Mount Johns displays a diverse mix of dwelling types, with above-average rates of outright home ownership
Mount Johns' dwelling structure, as per the latest Census, consisted of 44.6% houses and 55.4% other dwellings (semi-detached, apartments, 'other'). In comparison, Non-Metro NT had 67.8% houses and 32.2% other dwellings. Home ownership in Mount Johns was 14.8%, with mortgaged dwellings at 31.5% and rented ones at 53.7%. The median monthly mortgage repayment was $1,733, lower than Non-Metro NT's average of $1,800. Weekly rent in Mount Johns was $400, higher than Non-Metro NT's figure of $280. Nationally, Mount Johns' mortgage repayments were lower at $1,733 compared to the Australian average of $1,863, while rents were higher at $400 against the national figure of $375.
Frequently Asked Questions - Housing
Household Composition
Mount Johns features high concentrations of group households and lone person households, with a lower-than-average median household size
Family households account for 62.9% of all households, including 30.4% couples with children, 25.5% couples without children, and 6.9% single parent families. Non-family households consist of the remaining 37.1%, with lone person households at 31.1% and group households comprising 5.2%. The median household size is 2.4 people, which is smaller than the Rest of NT average of 2.8.
Frequently Asked Questions - Households
Local Schools & Education
The educational profile of Mount Johns exceeds national averages, with above-average qualification levels and academic performance metrics
Mount Johns has a notably high educational attainment among its residents aged 15 and above, with 42.2% holding university qualifications. This figure exceeds the broader benchmarks of SA4 region and Rest of NT, both at 20.1%. The area's educational advantage is reflected in its knowledge-based opportunities. Bachelor degrees are most prevalent at 27.9%, followed by postgraduate qualifications (11.1%) and graduate diplomas (3.2%).
Vocational credentials are also prominent, with 30.3% of residents holding such qualifications - advanced diplomas account for 11.2% and certificates for 19.1%. Educational participation is high in Mount Johns, with 28.5% of residents currently enrolled in formal education. This includes 10.2% in primary education, 6.1% in secondary education, and 5.7% pursuing tertiary education.
Frequently Asked Questions - Education
Schools Detail
Nearby Services & Amenities
Transport
Transport servicing is very low compared to other areas nationally based on assessment of service frequency, route connectivity and accessibility
Transport analysis indicates 13 active stops in Mount Johns offering bus services. These stops are served by three routes, facilitating 88 weekly passenger trips. Transport access is moderate, with residents located an average of 482 meters from the nearest stop.
Service frequency averages 12 trips daily across all routes, resulting in approximately six weekly trips per individual stop.
Frequently Asked Questions - Transport
Transport Stops Detail
Health
Mount Johns's residents boast exceedingly positive health performance metrics with very low prevalence of common health conditions across all age groups
Mount Johns demonstrates excellent health outcomes with very low prevalence of common health conditions across all age groups. Approximately 61% of its total population of 2,933 has private health cover, compared to 53.7% in the Rest of NT and a national average of 55.3%. The most prevalent medical conditions are asthma (5.9%) and mental health issues (5.4%), with 79.9% of residents reporting no medical ailments, compared to 76.9% in the Rest of NT.
As of 2021, 8.9% of Mount Johns' population is aged 65 and over (427 people), and seniors' health outcomes align with those of the general population.
Frequently Asked Questions - Health
Cultural Diversity
Mount Johns was found to be more culturally diverse than the vast majority of local markets in Australia, upon assessment of a range of language and cultural background related metrics
Mount Johns has a high level of cultural diversity, with 28.8% of its population speaking a language other than English at home and 42.8% born overseas. Christianity is the main religion in Mount Johns, making up 45.6% of people there. However, the most notable overrepresentation is seen in the 'Other' category, which comprises 2.5% of the population compared to 2.1% across the rest of the Northern Territory.
Regarding ancestry, the top three represented groups in Mount Johns are English (21.5%), Australian (17.3%), and Other (15.2%), with the latter being substantially higher than the regional average of 9.7%. There are also notable differences in the representation of certain ethnic groups: Filipino is overrepresented at 3.1% compared to 1.7% regionally, Australian Aboriginal is underrepresented at 7.1% versus 28.9%, and Maori is equally represented at 1.1%.
Frequently Asked Questions - Diversity
Age
Mount Johns's population is younger than the national pattern
Mount Johns has a median age of 35, which is higher than the Rest of NT figure of 31 but lower than the Australian median of 38. Compared to Rest of NT, Mount Johns has a higher proportion of residents aged 35-44 (19.2%) but fewer residents aged 5-14 (9.8%). This concentration of 35-44 year-olds is significantly higher than the national figure of 14.2%. Between 2021 and now, the proportion of Mount Johns' population aged 15-24 has increased from 8.8% to 11.4%, while the 35-44 age group has risen from 17.3% to 19.2%. Conversely, the 25-34 age group has decreased from 22.5% to 20.6%, and the 0-4 age group has dropped from 7.4% to 6.2%. Looking ahead to 2041, demographic projections show that the 45-54 age cohort is expected to rise substantially, with an increase of 306 people (54%) from 566 to 873.
