Chart Color Schemes
This analysis uses ABS Statistical Areas Level 2 (SA2) boundaries, which can materially differ from Suburbs and Localities (SAL) even when sharing similar names.
SA2 boundaries are defined by the Australian Bureau of Statistics and are designed to represent communities for statistical reporting (e.g., census and ERP).
Suburbs and Localities (SAL) represent commonly-used suburb/locality names (postal-style areas) and may use different geographic boundaries. For comprehensive analysis, consider reviewing both boundary types if available.
est. as @ -- *
ABS ERP | -- people | --
2021 Census | -- people
Sales Activity
Curious about local property values? Filter the chart to assess the volume and appreciation (including resales) trends and regional comparisons, or scroll to the map below view this information at an individual property level.
Find a Recent Sale
Sales Detail
Population
Charles has shown very soft population growth performance across periods assessed by AreaSearch
Charles's population was around 4,706 as of November 2025. This figure reflects an increase of 491 people from the 2021 Census total of 4,215. The change is inferred from the estimated resident population of 4,696 in June 2024 and two validated new addresses since the Census date. This results in a density ratio of 282 persons per square kilometer. Charles's growth rate of 11.6% since the 2021 census exceeded the national average of 8.9%. Overseas migration contributed approximately 53.1% of overall population gains during recent periods.
AreaSearch uses ABS/Geoscience Australia projections for each SA2 area, released in 2024 with a base year of 2022. For areas not covered by this data and post-2032 estimates, growth rates by age cohort are applied from the ABS's latest Greater Capital Region projections (released in 2023, based on 2022 data). By 2041, the population is expected to increase by just below the median of Australia's non-metropolitan areas, with an expansion of 522 persons, reflecting a total increase of 10.9% over the 17 years.
Frequently Asked Questions - Population
Development
AreaSearch assessment of residential development drivers sees a low level of activity in Charles, placing the area among the bottom 25% of areas assessed nationally
Charles recorded approximately 9 residential properties granted approval each year over the past five financial years, totalling 45 homes. As of FY-26, 0 approvals have been recorded. On average, 0.7 new residents per year per dwelling constructed were reported between FY-21 and FY-25. This suggests that new construction is meeting or exceeding demand, providing buyers with more options and potentially enabling population growth beyond current projections.
The average value of new homes being built was $599,000, indicating a focus on the premium market with high-end developments. In this financial year, there have been $46.8 million in commercial approvals, suggesting strong local business investment. Compared to the Rest of NT, Charles shows moderately higher construction activity, at 14.0% above the regional average per person over the five-year period. This balances buyer choice while supporting current property values.
However, development activity is below the national average, indicating the area's established nature and suggesting potential planning limitations. New development consists of 88.0% standalone homes and 12.0% townhouses or apartments, preserving the area's low density nature with an emphasis on detached housing attracting space-seeking buyers. The estimated population per dwelling approval is 2608 people, reflecting its quiet, low activity development environment. Population forecasts indicate Charles will gain 512 residents by 2041, according to the latest AreaSearch quarterly estimate. If current development rates continue, housing supply may not keep pace with population growth, potentially increasing competition among buyers and supporting stronger price growth.
Frequently Asked Questions - Development
Infrastructure
Charles has limited levels of nearby infrastructure activity, ranking in the 14thth percentile nationally
Changes to local infrastructure significantly impact an area's performance. AreaSearch has identified 18 projects likely affecting this region. Notable ones are Alice Springs Hospital Emergency Department Redevelopment, Aboriginal and Torres Strait Islander Art Gallery of Australia, Alice Springs Flood Mitigation Project, Madigan Street (Braitling) Infill Subdivision. The following list details those most relevant.
Professional plan users can use the search below to filter and access additional projects.
INFRASTRUCTURE SEARCH
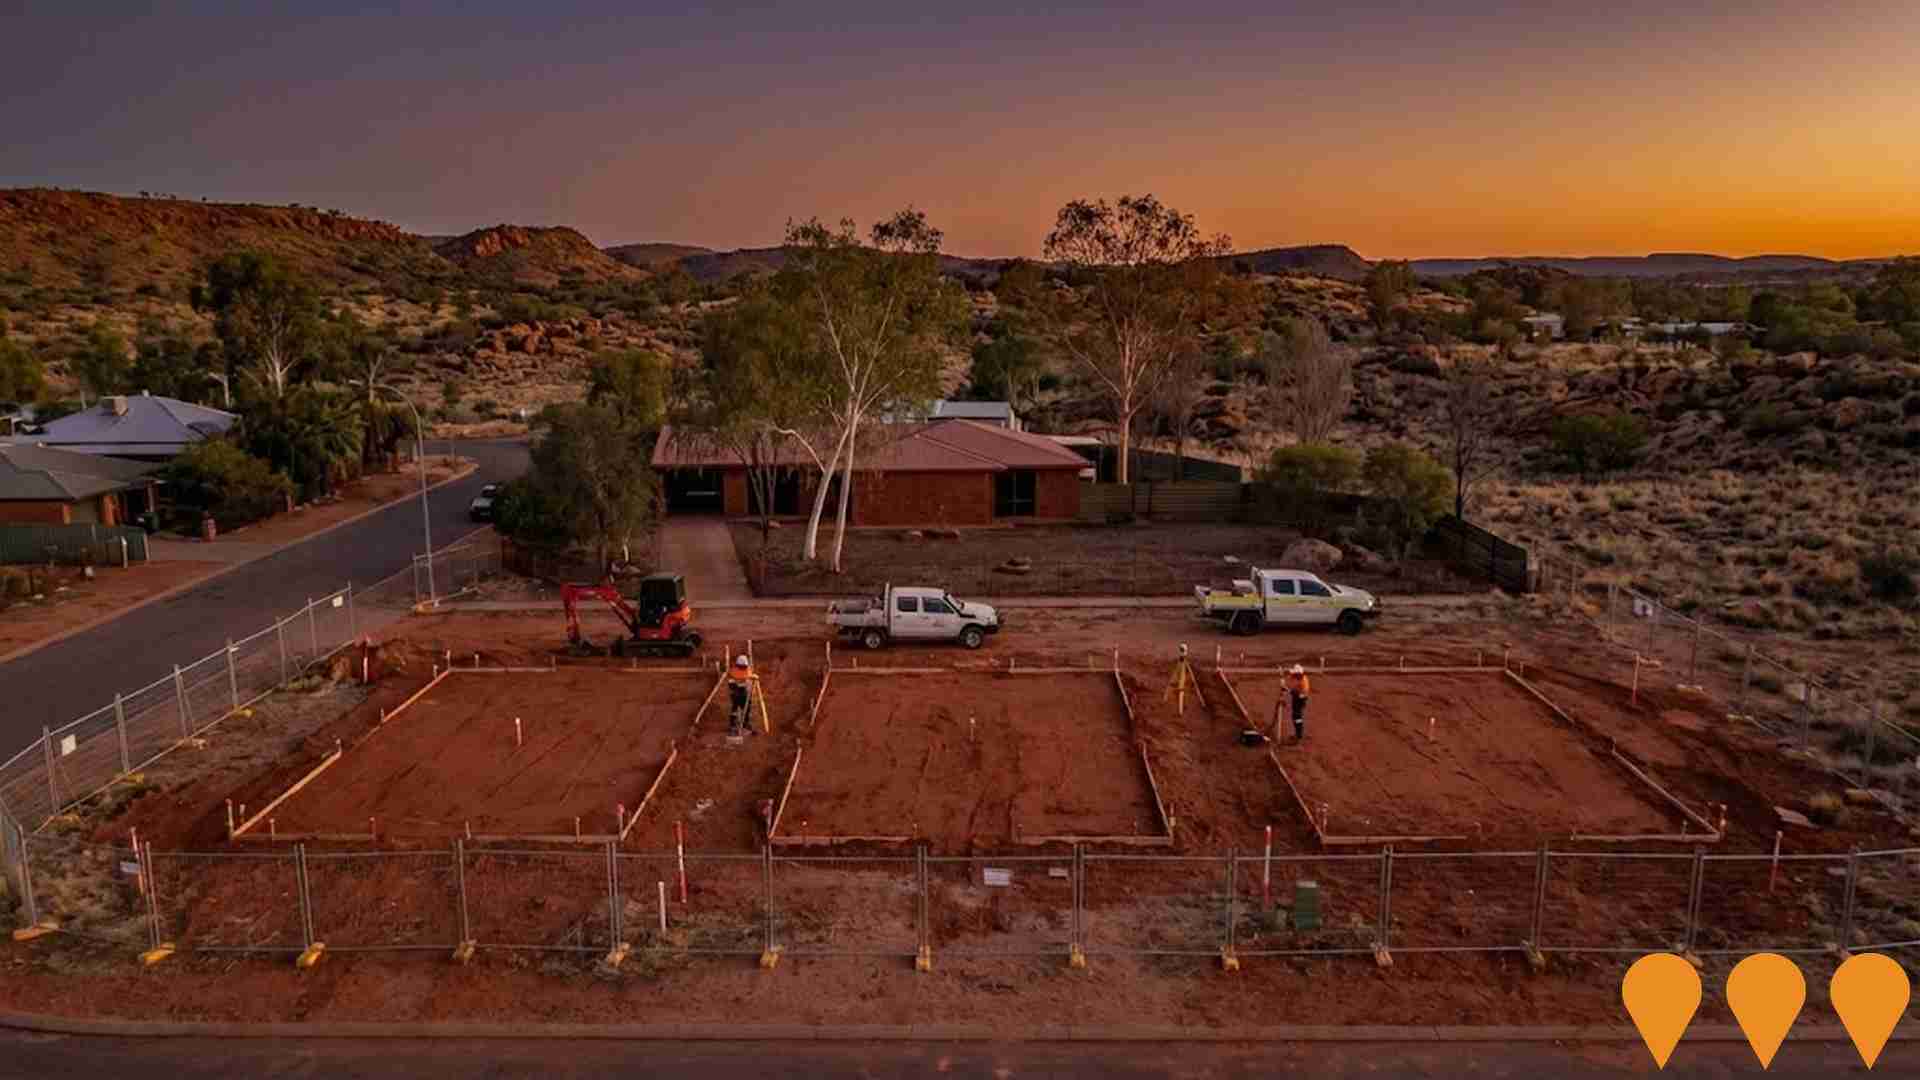
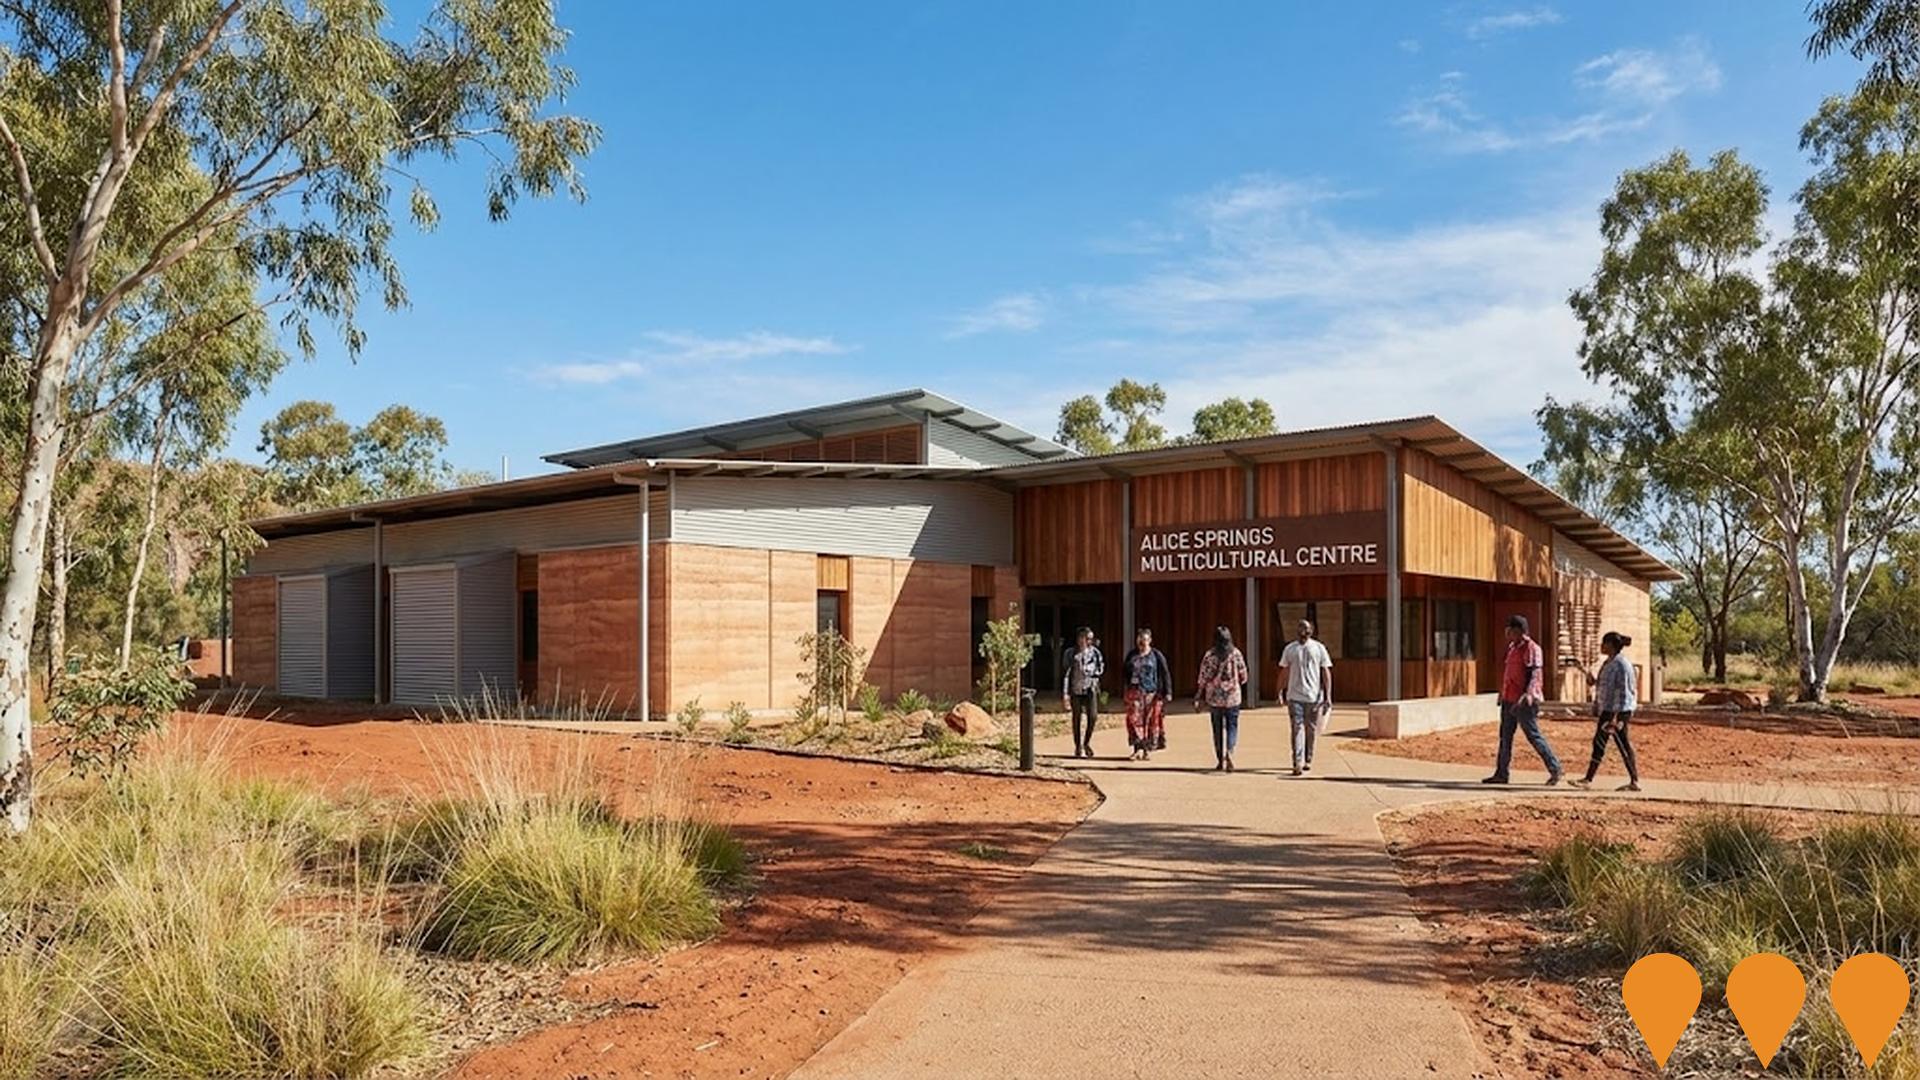
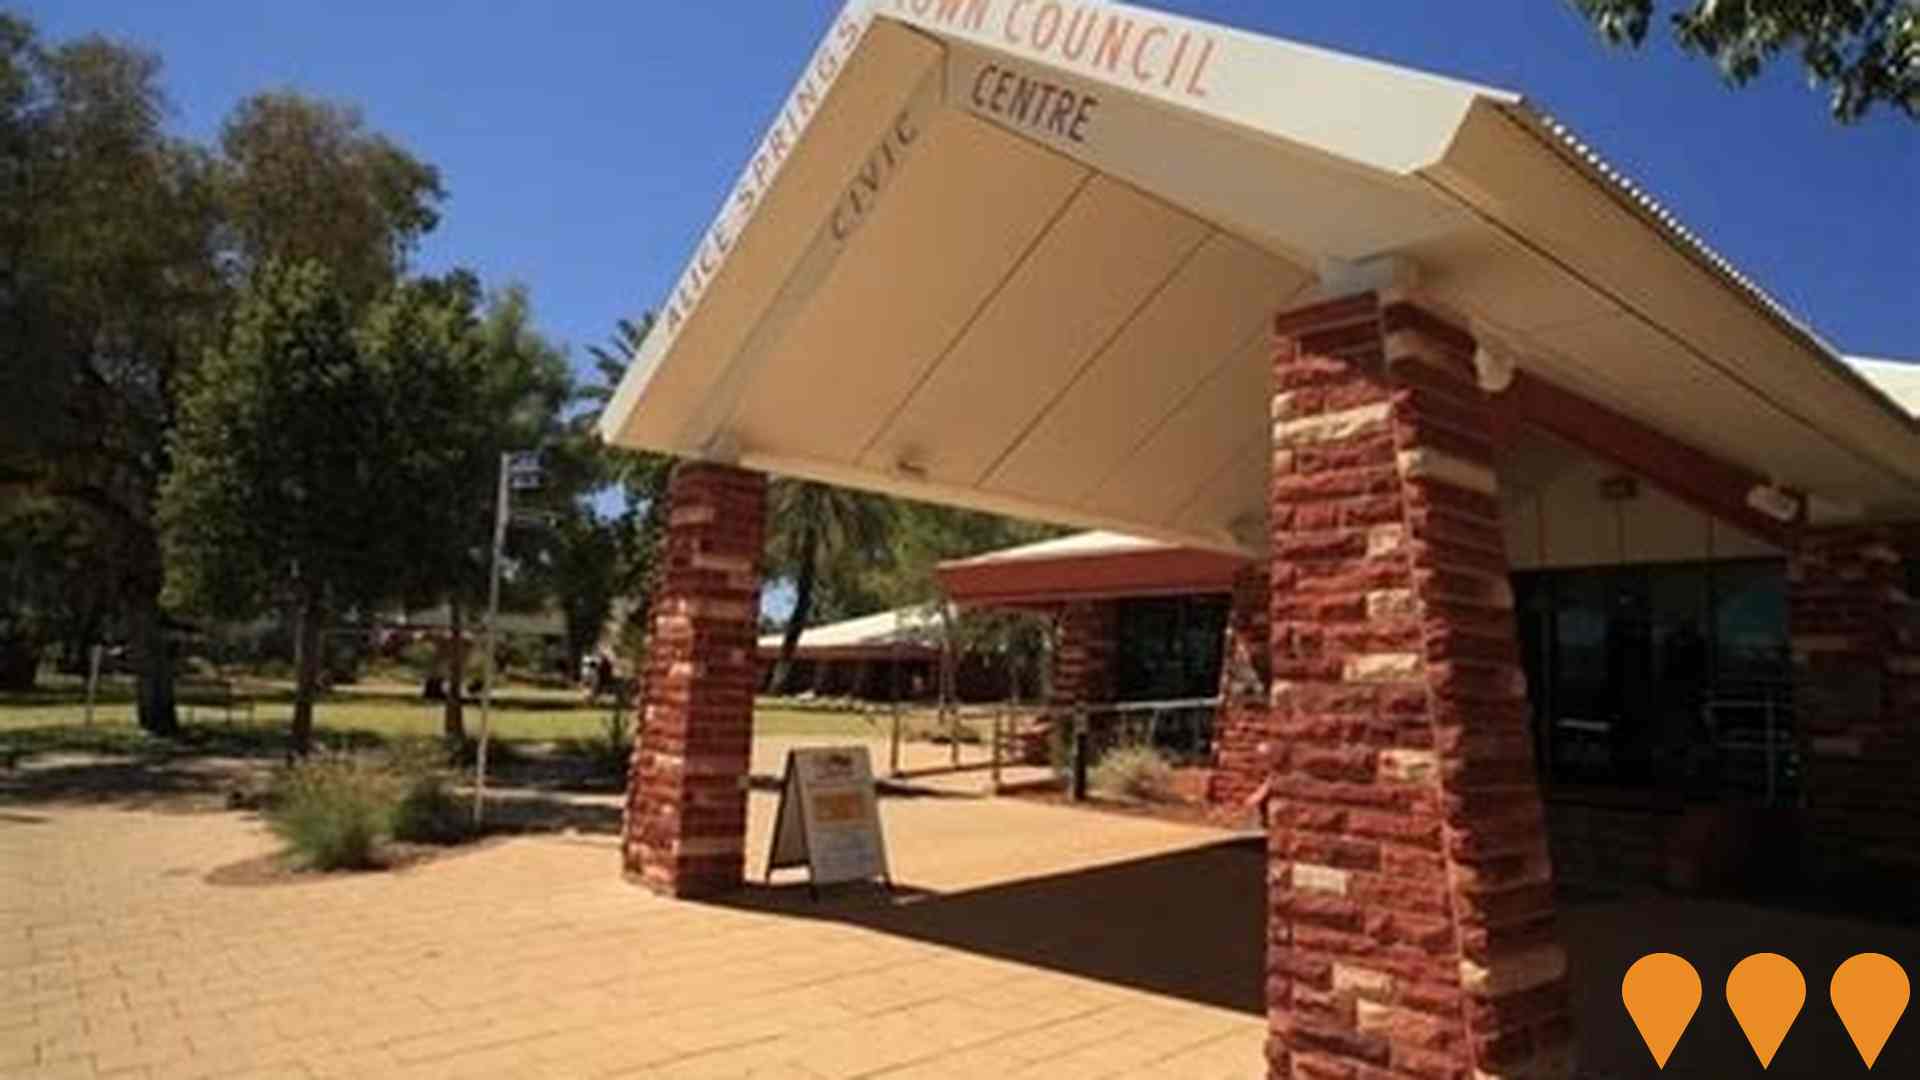
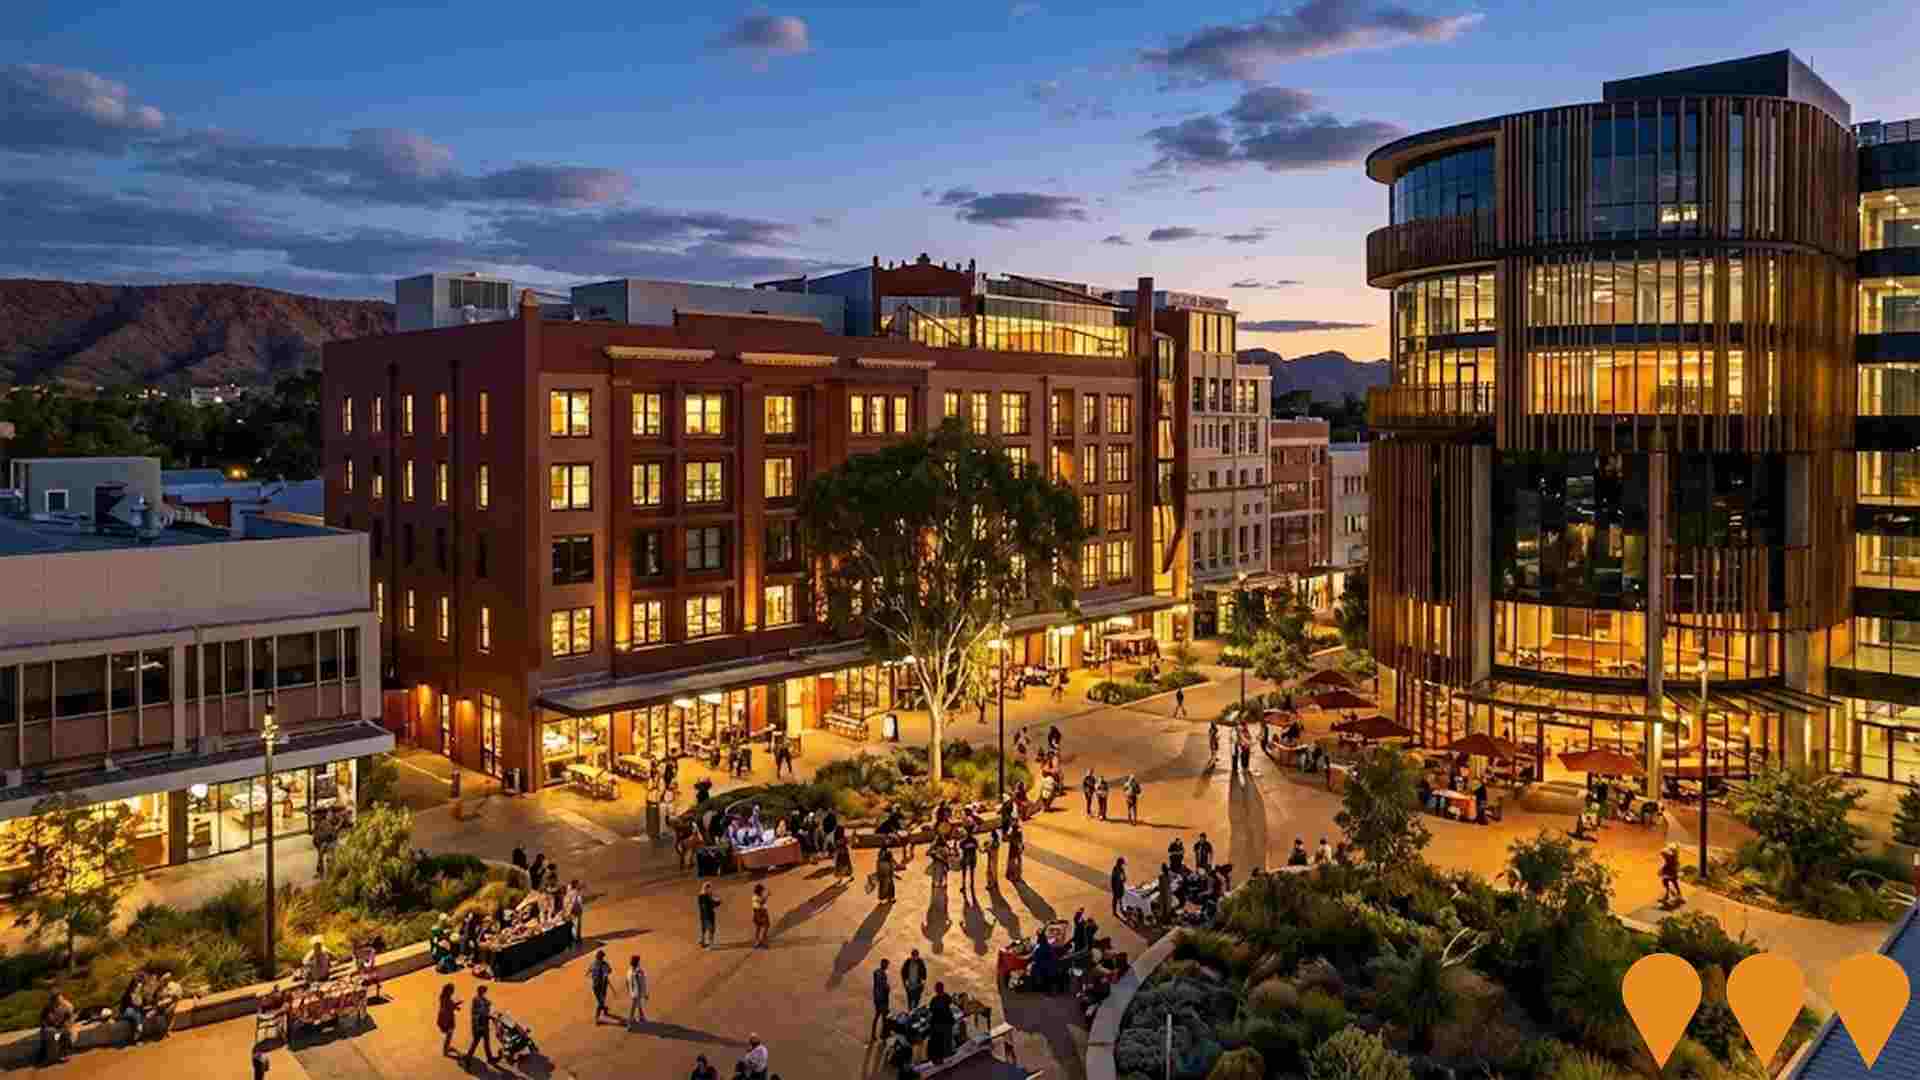
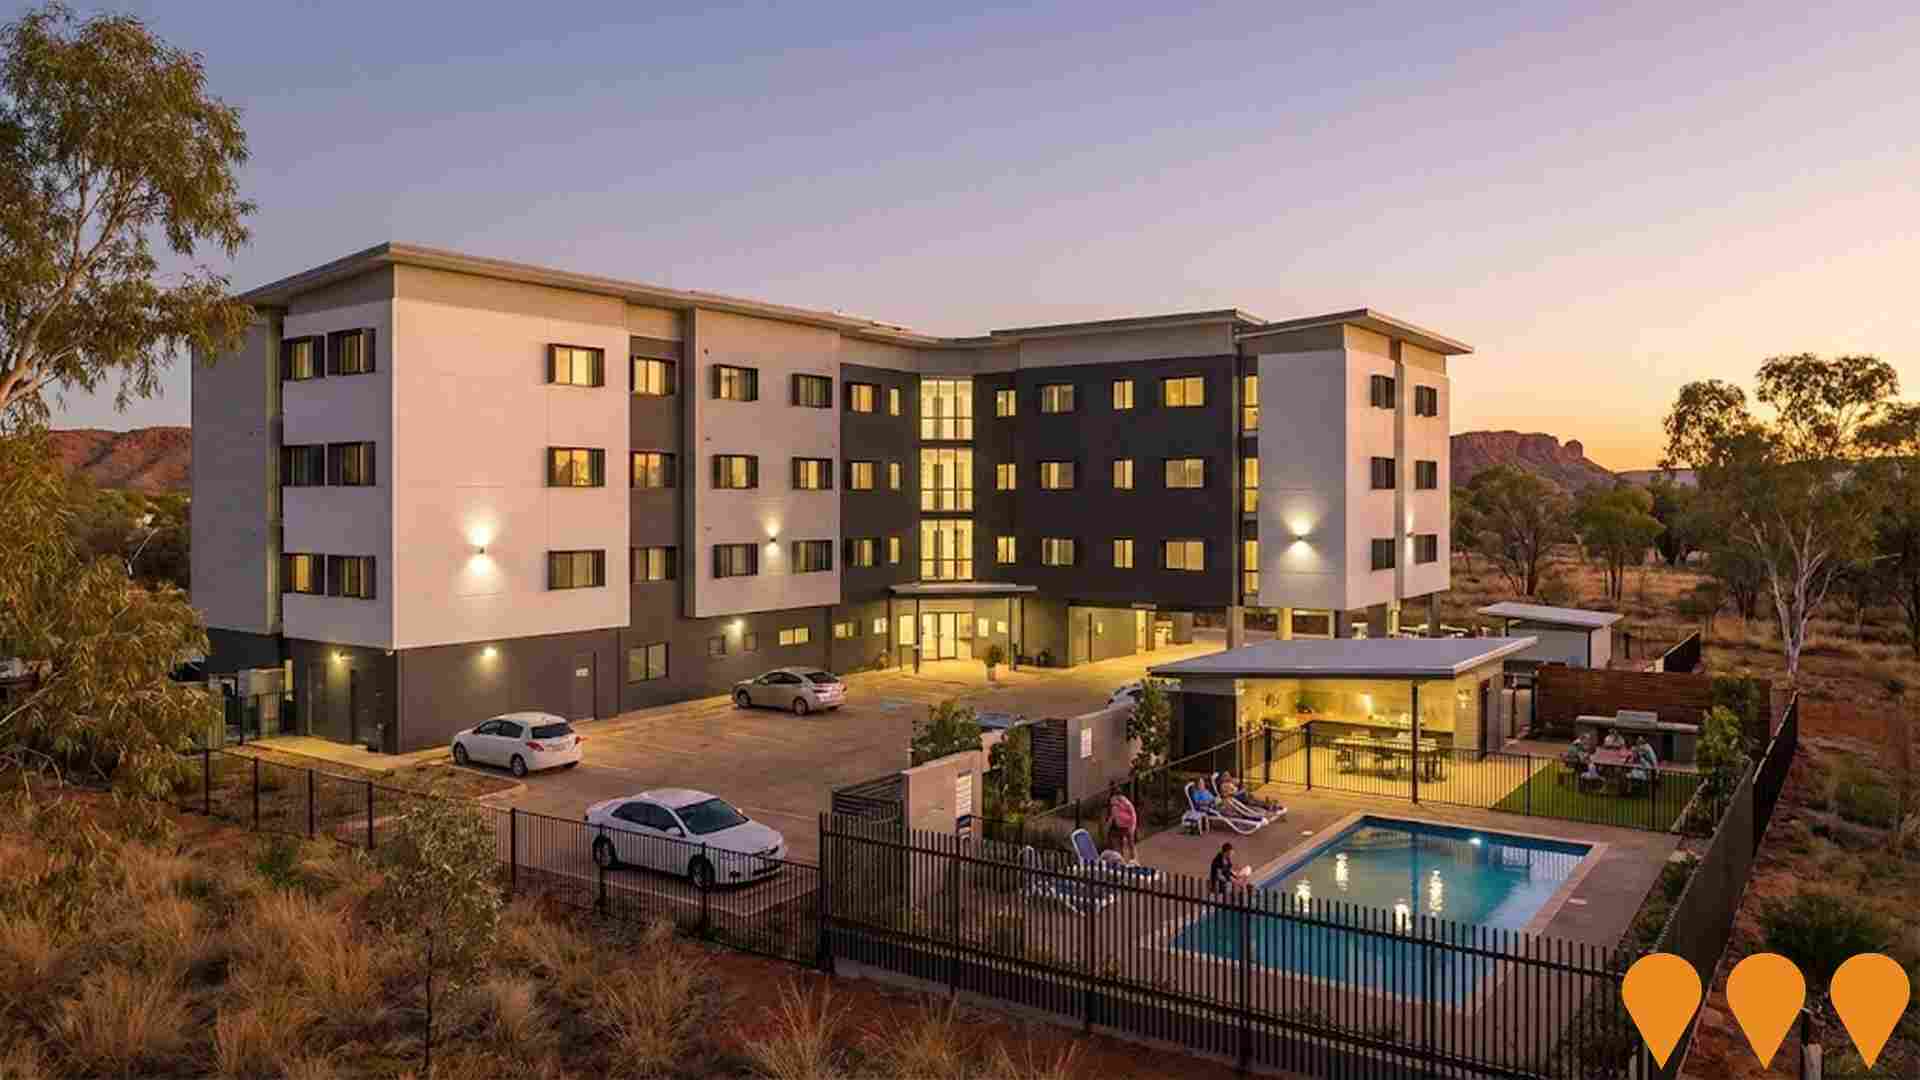
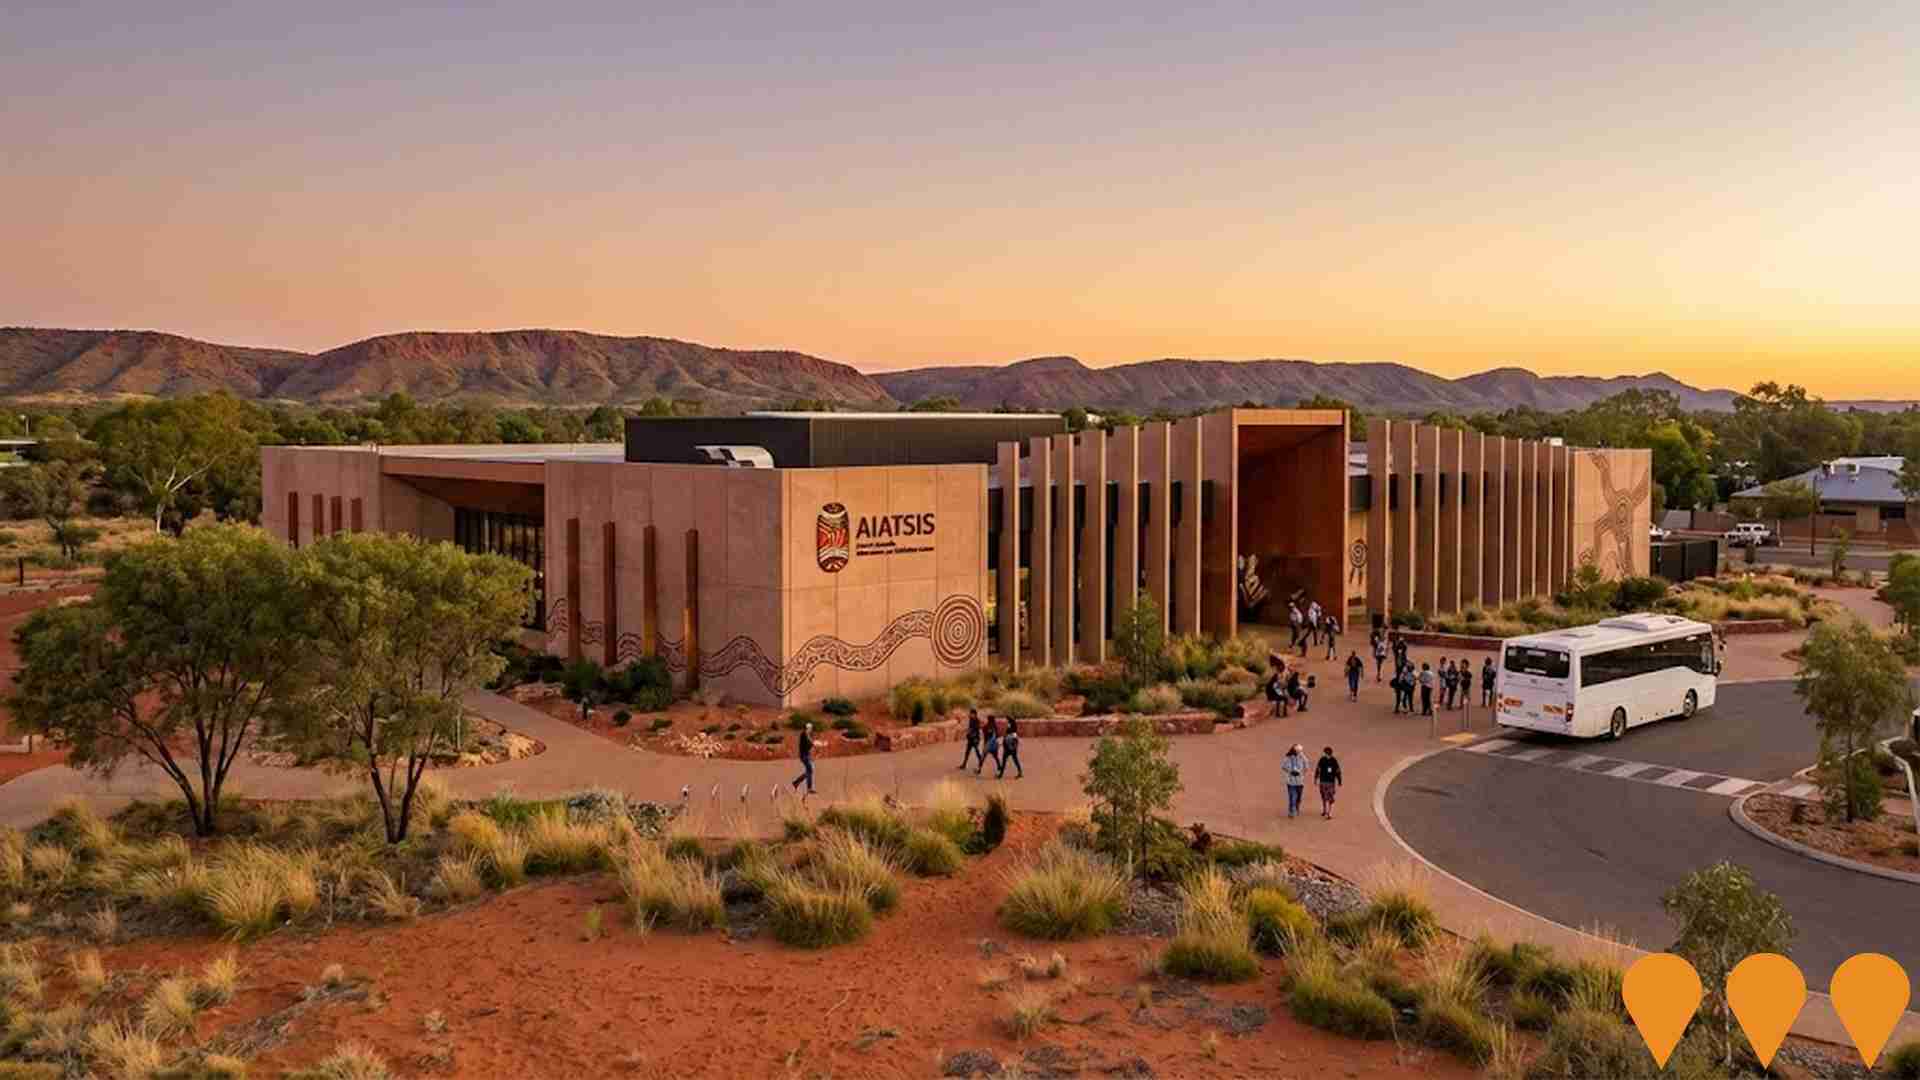
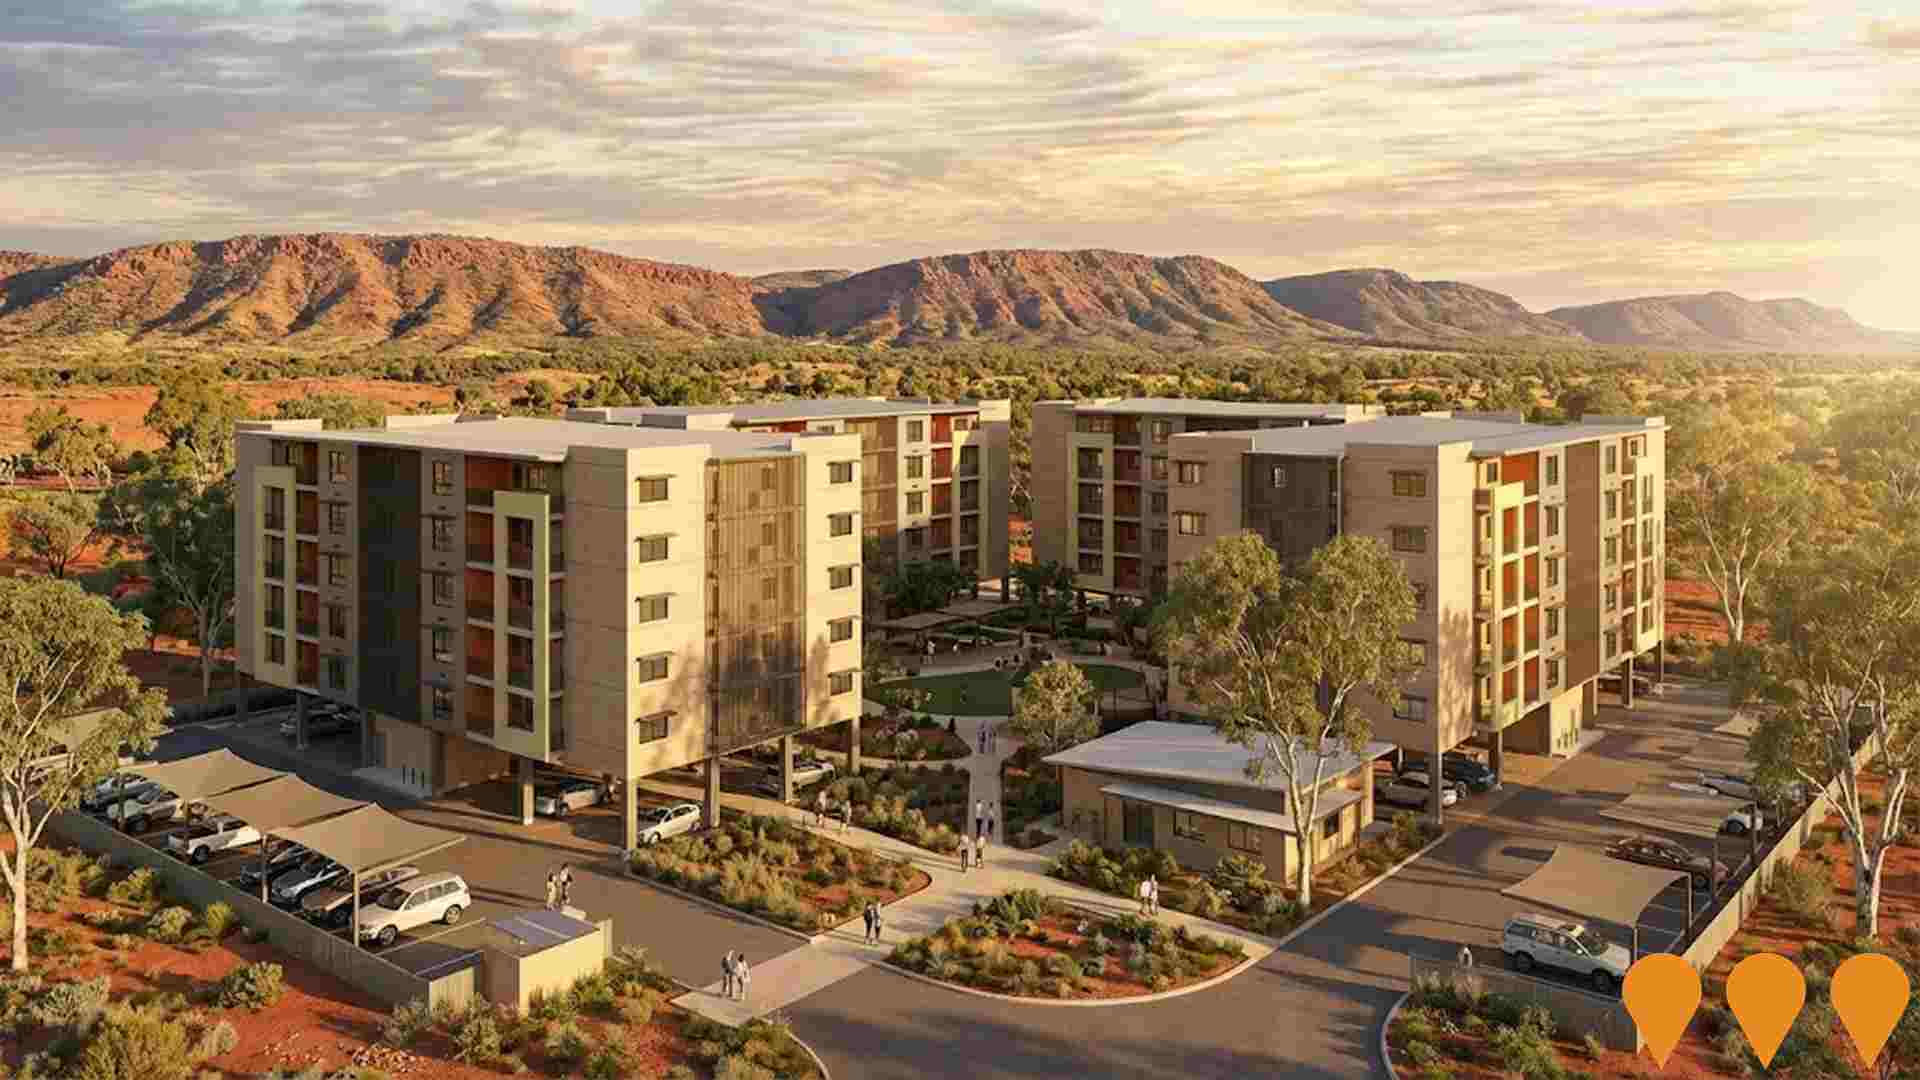
 Denotes AI-based impression for illustrative purposes only, not to be taken as definitive under any circumstances. Please follow links and conduct other investigations from the project's source for actual imagery. Developers and project owners wishing us to use original imagery please Contact Us and we will do so.
Frequently Asked Questions - Infrastructure
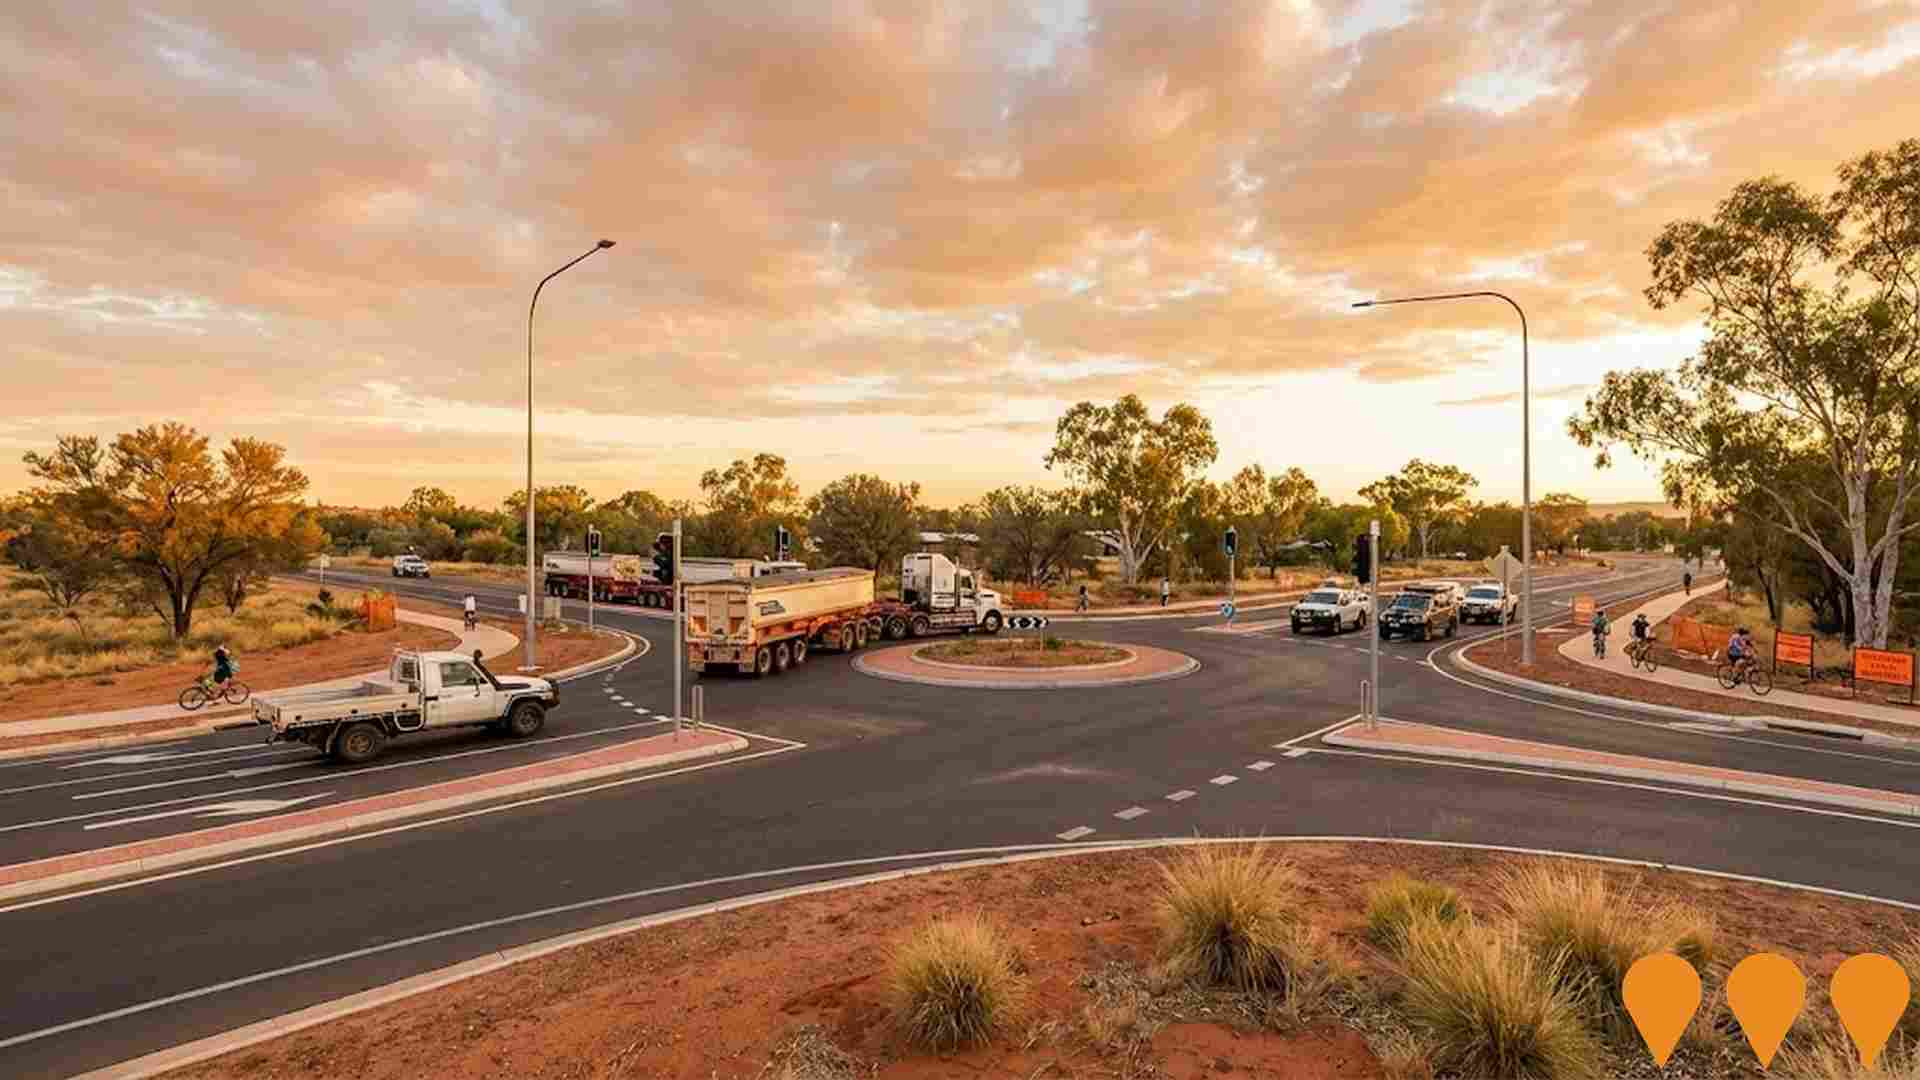
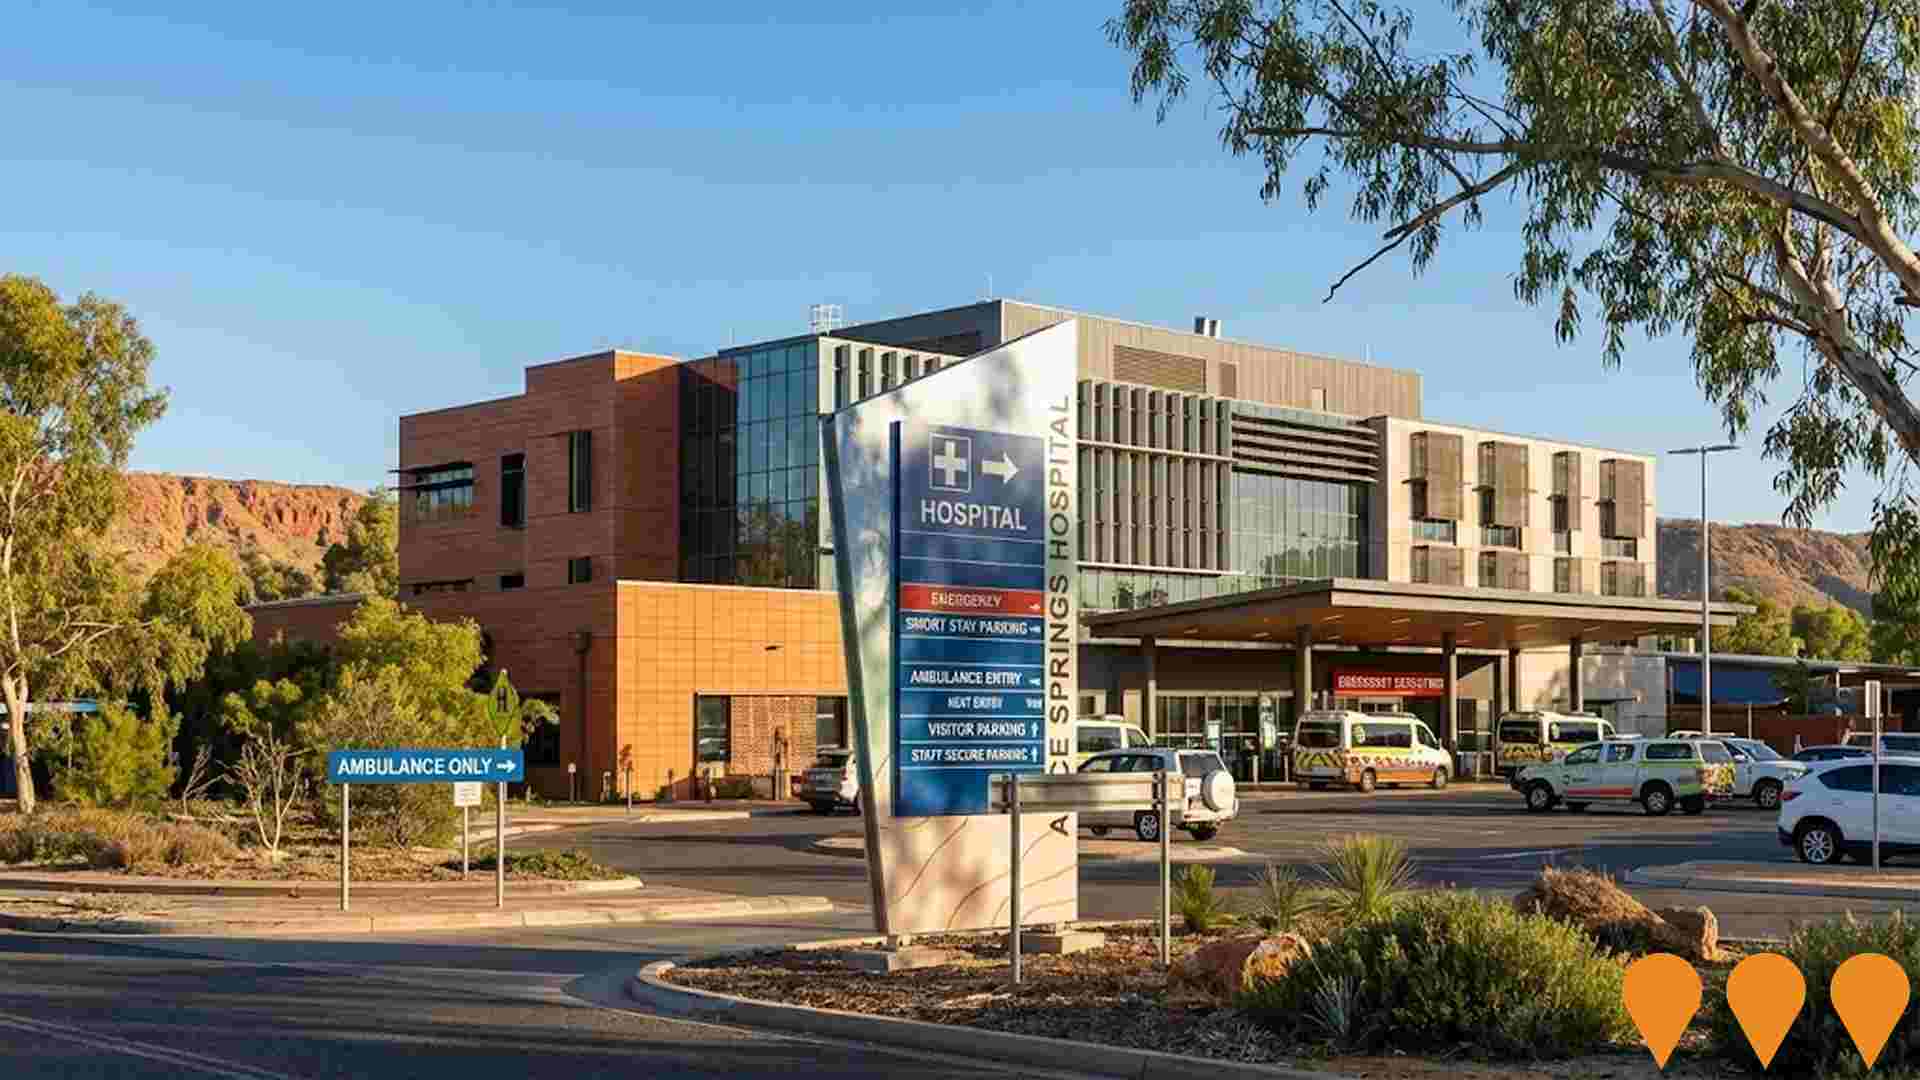
Alice Springs Hospital Emergency Department Redevelopment
Major redevelopment and expansion of the Alice Springs Hospital Emergency Department to deliver a larger, modern facility with increased treatment spaces, dedicated paediatric area, fast-track zone, and improved resuscitation capabilities for Central Australia's primary acute care hospital.
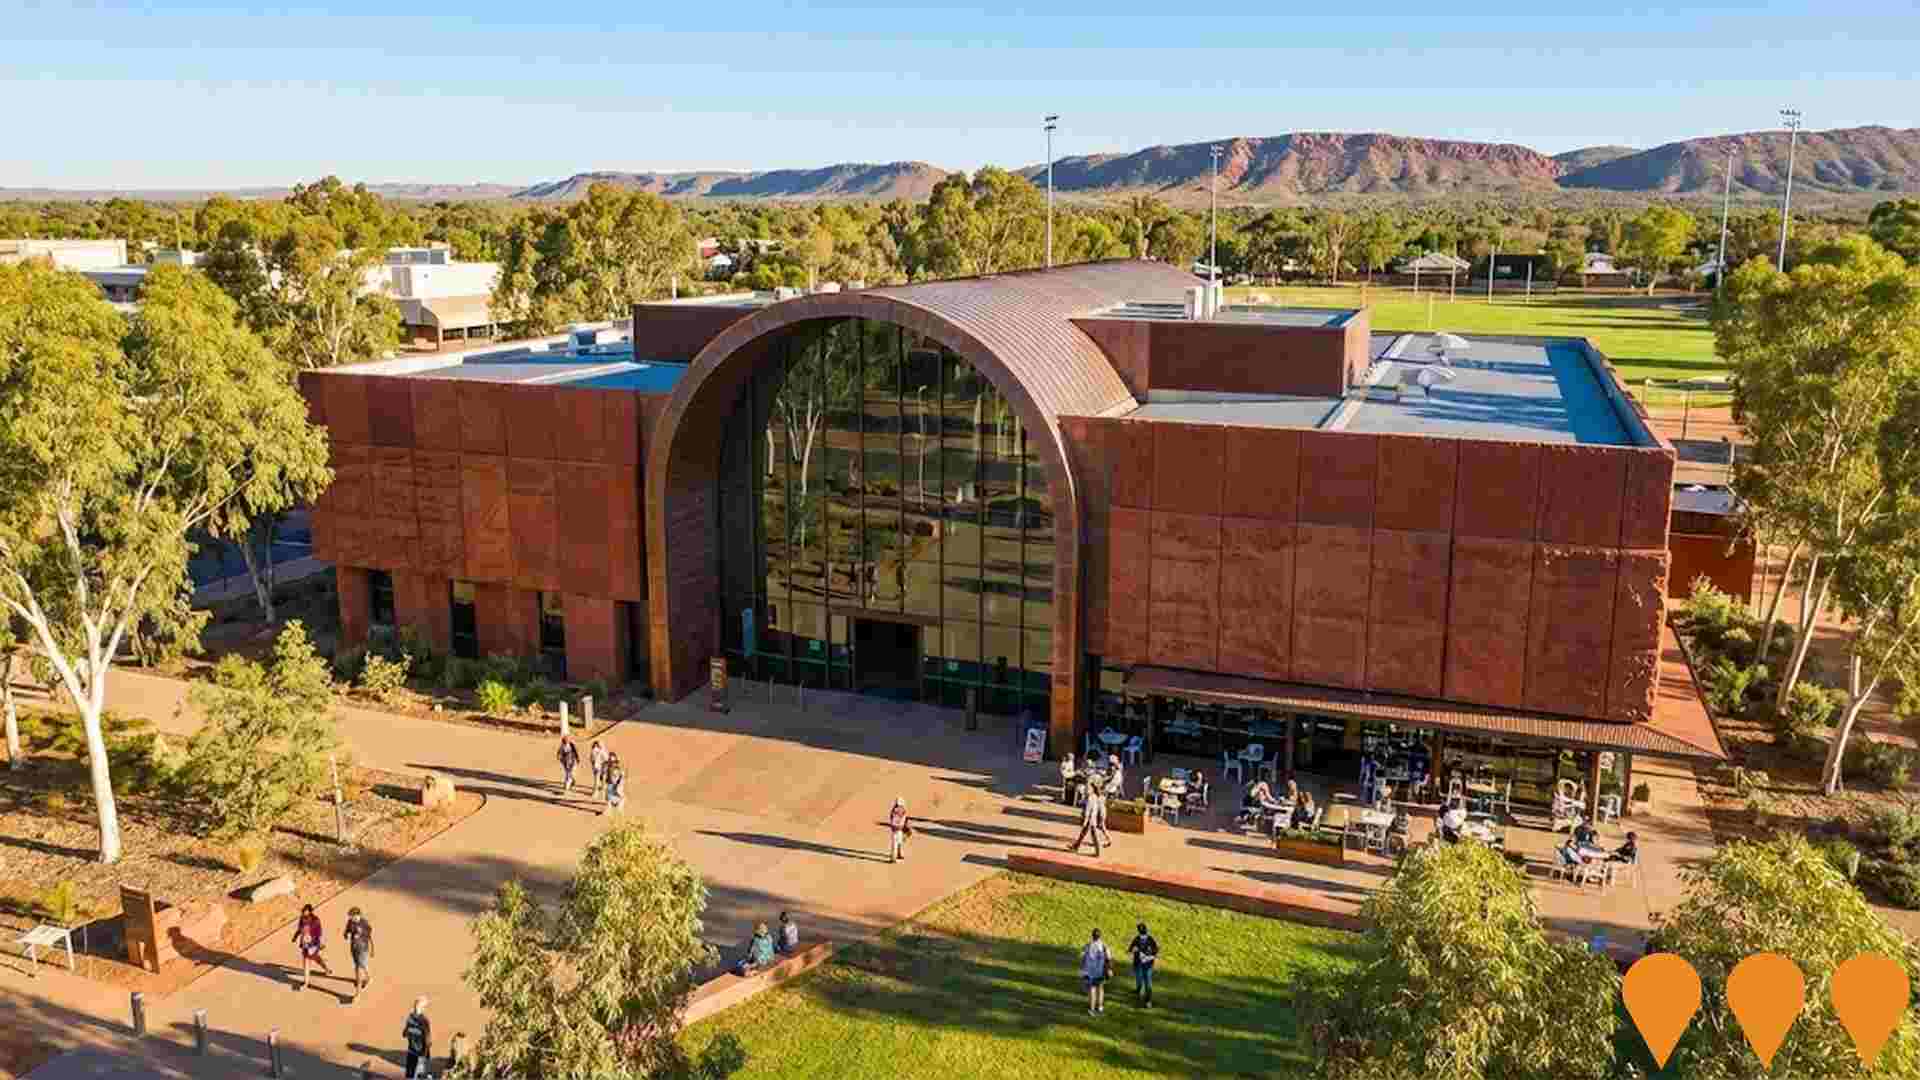
Aboriginal and Torres Strait Islander Art Gallery of Australia
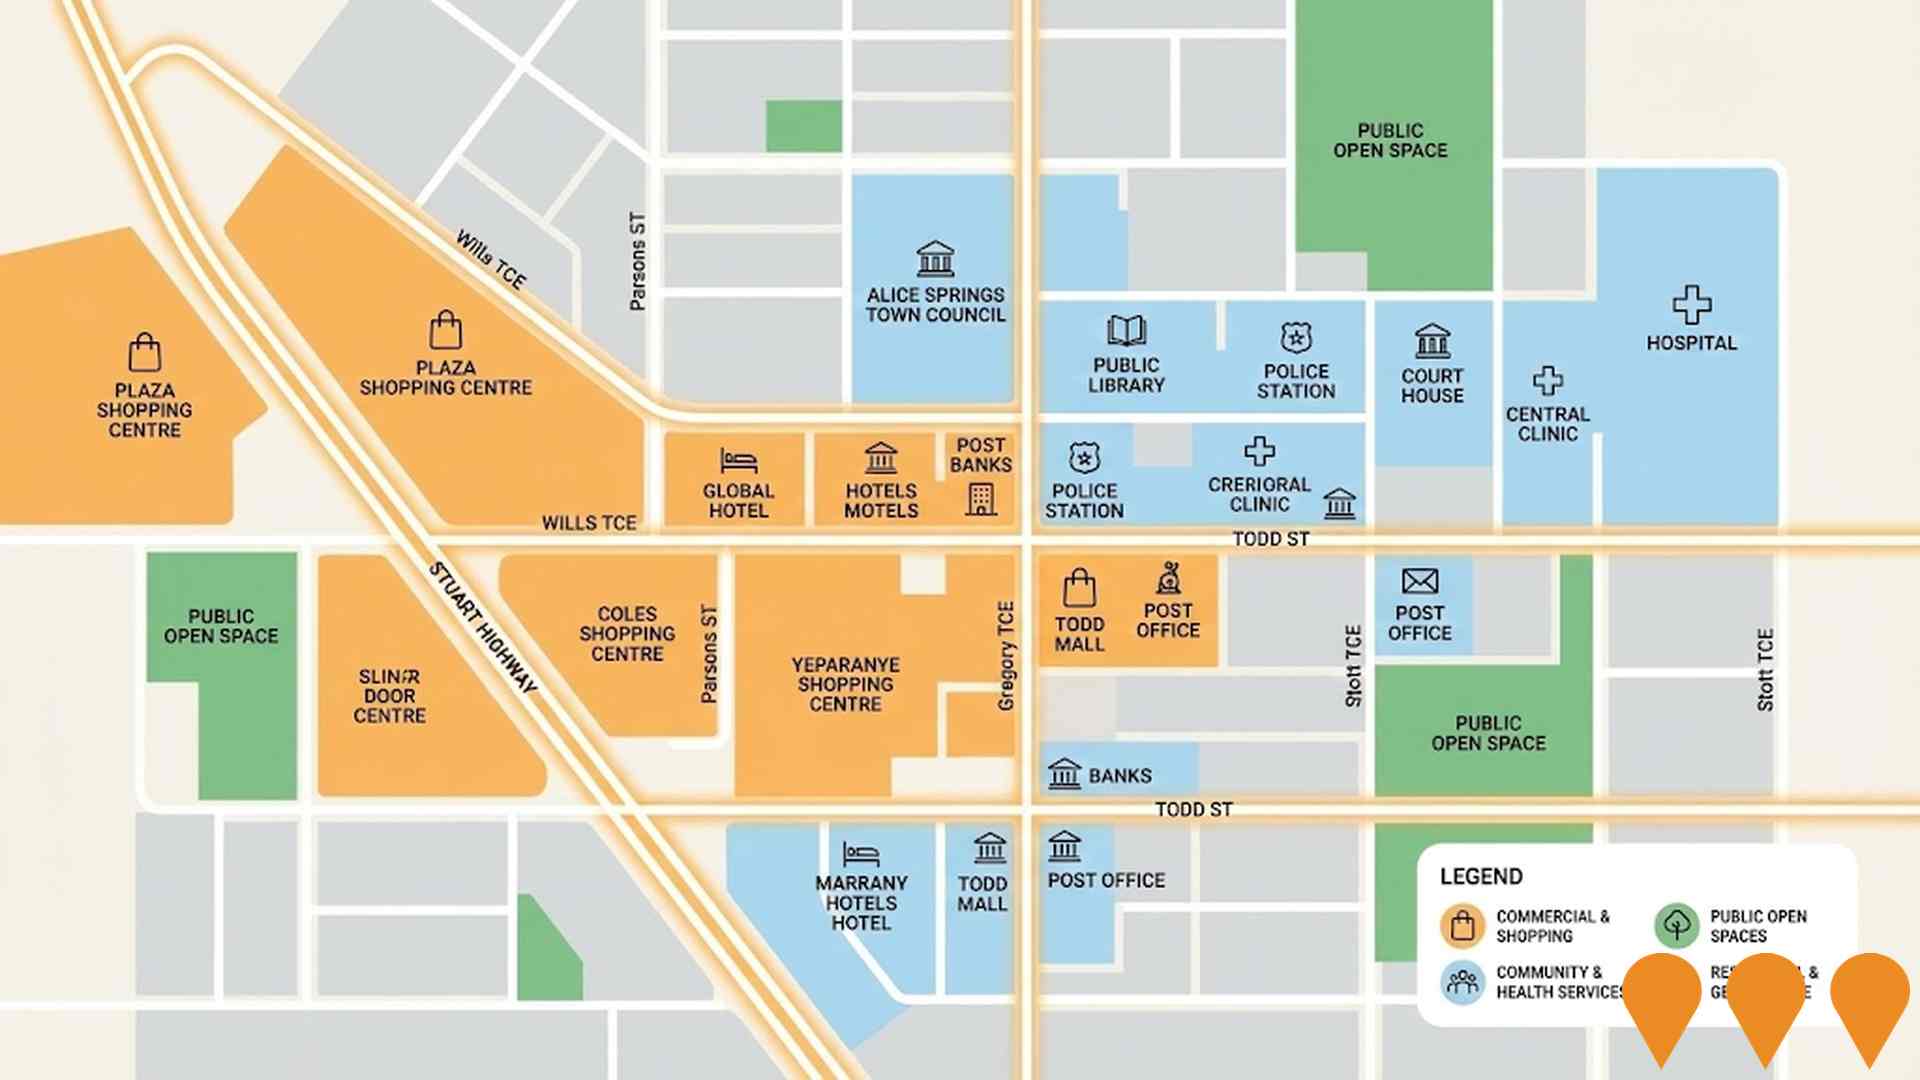
A world-class national gallery celebrating the artistic traditions and cultural expressions of Australia's Aboriginal and Torres Strait Islander peoples. The revised design features a 3-storey, 4,000 square meter building with over 1,300 square meters of exhibition space for major touring and international exhibitions. Located in the heart of Alice Springs CBD on the southern portion of the Anzac Oval precinct at the Wills Terrace car park site. The gallery will include a public cafe, community forecourt with seating and landscaping, secure loading dock, art quarantine and conservation spaces, and staff facilities. Design reached 50% completion in July 2025 with development consent application submitted. The project aims to showcase First Nations art from the birthplace of contemporary Aboriginal art, Mparntwe (Alice Springs), driving cultural tourism and economic growth. Not a collecting gallery but focused on exhibitions and celebrating Aboriginal and Torres Strait Islander arts.
Central Alice Springs Area Plan
The Central Alice Springs Area Plan was finalised in 2021 and is now an active planning policy document under the Northern Territory Planning Scheme. It provides detailed land-use guidance and zoning for the central business district and surrounding precincts, supporting commercial, medical, tourism, cultural and residential development in Alice Springs.
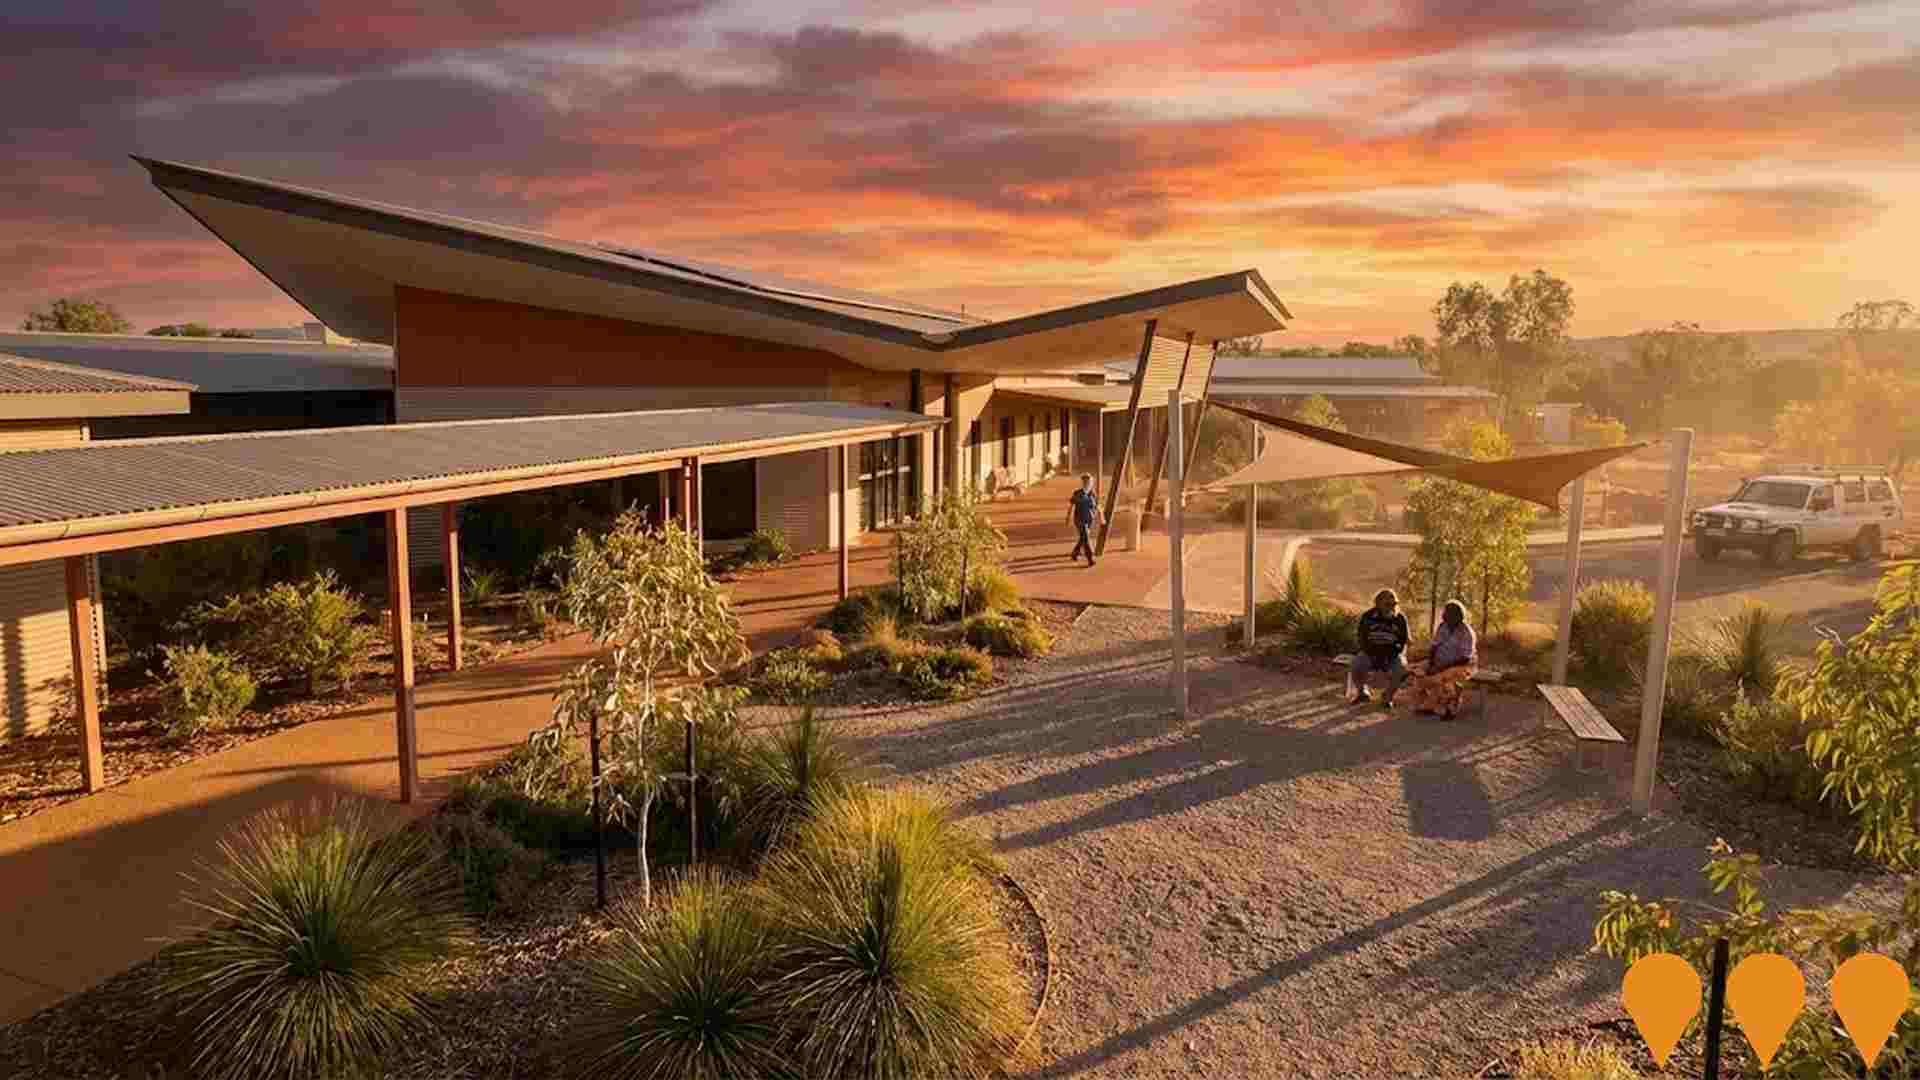
NT Health Staff Accommodation Project
Purpose-built accommodation complex for hospital workers featuring 71 units (41 one-bedroom, 20 two-bedroom, 10 three-bedroom), plus amenities including swimming pool, gymnasium, BBQ areas, and undercover parking. Designed to attract and retain health professionals in Central Australia.
Alice Springs Flood Mitigation Project
Major flood mitigation infrastructure project to reduce flooding impacts in Alice Springs through trunk drainage upgrades. Engineering feasibility assessment underway to inform concept design of key trunk drainage infrastructure to mitigate flooding from the Todd River and localized stormwater overflows. The project focuses on structural flood mitigation measures including upgrades to major drainage infrastructure and is expected to reduce flooding impacts on 386 properties, providing flood immunity for public roads and improved protection for residential areas in localised flooding events up to a 1 in 100 year event.

Alice Springs CBD Revitalisation Project
Northern Territory Government program to transform the Alice Springs CBD into a greener, cooler and safer town centre through shade structures and tree planting, lighting and CCTV upgrades including Billy Goat Hill, wayfinding, traffic calming and streetscape works. A River Activation Space opened in February 2022. Final road reseal and line marking works occurred April-May 2024 with the project marked complete in July 2024.

AIATSIS Central Australia Information and Exhibition Centre
New information and exhibition centre showcasing Aboriginal and Torres Strait Islander culture and heritage in Central Australia. Opened in February 2024 as a significant cultural facility in the heart of Alice Springs' main shopping and tourism precinct.
Melanka Accelerated Accommodation Development
An approved development application for 144 apartments across six buildings (five at six storeys, one at five storeys) plus a single-storey office building at the former Melanka backpackers hostel site. The complex includes 50% of units to be acquired by the NT Government for key worker accommodation, with the remainder available for private sale and rent. Designed by DKJ Architects as sculptural urban art integrated with landscape, the project was reduced from an original proposal of 174 apartments following community consultation. The development is valued at approximately $100 million and designed to accommodate transient workers while establishing a sense of arrival that respects the existing built form and Todd Street's visual characteristics.
Employment
The labour market in Charles demonstrates typical performance when compared to similar areas across Australia
Charles has a skilled workforce with an unemployment rate of 3.1% as of September 2025. There are 3,174 residents in work, which is 2.8% below the Rest of NT's rate of 5.9%.
The workforce participation rate is 65.6%, compared to the Rest of NT's 50.7%. Employment among residents is concentrated in health care & social assistance, public administration & safety, and construction. The area has a particular employment specialization in professional & technical services, with an employment share of 1.9 times the regional level. Agriculture, forestry & fishing has limited presence with 1.1% employment compared to 5.0% regionally.
There are 1.9 workers for every resident, indicating that the area functions as an employment hub hosting more jobs than residents and attracting workers from surrounding areas. Over the 12 months to September 2025, labour force levels decreased by 1.4%, while employment declined by 1.1%, causing the unemployment rate to fall by 0.3 percentage points. By comparison, Rest of NT recorded an employment decline of 1.3% and a labour force decline of 1.2%, with unemployment rising marginally. Jobs and Skills Australia's national employment forecasts from May-25 suggest that national employment is forecast to expand by 6.6% over five years and 13.7% over ten years, but growth rates differ significantly between industry sectors. Applying these industry-specific projections to Charles's employment mix suggests local employment should increase by 6.9% over five years and 14.2% over ten years.
Frequently Asked Questions - Employment
Income
Income metrics indicate excellent economic conditions, with the area achieving higher performance than 75% of national locations assessed by AreaSearch
AreaSearch's latest postcode level ATO data for financial year 2022 indicates Charles SA2 had a median income among taxpayers of $61,072 and an average of $68,365. This is higher than the national average. The Rest of NT had a median income of $51,655 and an average of $61,577 during the same period. Based on Wage Price Index growth of 12.01% since financial year 2022, estimated incomes as of September 2025 would be approximately $68,407 (median) and $76,576 (average). Census 2021 income data shows individual earnings in Charles SA2 stand out at the 84th percentile nationally, with weekly earnings of $1,073. Income brackets indicate that 33.8% of residents earn between $1,500 and $2,999 per week (1,590 individuals). This is similar to the regional pattern where 33.6% occupy this income range. After housing costs, residents retain 92.4% of their income, reflecting strong purchasing power in the area. Charles SA2's SEIFA income ranking places it in the 5th decile.
Frequently Asked Questions - Income
Housing
Charles is characterized by a predominantly suburban housing profile, with above-average rates of outright home ownership
The latest Census evaluated dwelling structures in Charles as 73.5% houses and 26.6% other dwellings (semi-detached, apartments, 'other' dwellings). In comparison, Non-Metro NT had 67.8% houses and 32.2% other dwellings. Home ownership in Charles was at 17.4%, with the rest being mortgaged (38.6%) or rented (44.0%). The median monthly mortgage repayment in Charles was $0, lower than Non-Metro NT's average and significantly below the national average of $1,863. The median weekly rent figure in Charles was recorded at $350, compared to Non-Metro NT's $280 and the national figure of $375.
Frequently Asked Questions - Housing
Household Composition
Charles features high concentrations of group households, with a lower-than-average median household size
Family households account for 68.3% of all households, including 27.9% couples with children, 24.9% couples without children, and 13.3% single parent families. Non-family households constitute the remaining 31.7%, with lone person households at 27.1% and group households making up 4.9%. The median household size is 2.6 people, which is smaller than the Rest of NT average of 2.8.
Frequently Asked Questions - Households
Local Schools & Education
Educational outcomes in Charles fall within the lower quartile nationally, indicating opportunities for improvement in qualification attainment
The area's educational profile is notable regionally, with university qualification rates of 27.0% among residents aged 15+, exceeding the SA4 region average of 20.1% and that of Rest of NT (20.1%). Bachelor degrees are most prevalent at 16.5%, followed by postgraduate qualifications at 7.1% and graduate diplomas at 3.4%. Trade and technical skills are prominent, with 35.3% of residents aged 15+ holding vocational credentials – advanced diplomas at 9.3% and certificates at 26.0%.
Educational participation is notably high, with 30.7% of residents currently enrolled in formal education, including 11.6% in primary education, 8.4% in secondary education, and 4.4% pursuing tertiary education.
Frequently Asked Questions - Education
Schools Detail
Nearby Services & Amenities
Transport
Transport servicing is low compared to other areas nationally based on assessment of service frequency, route connectivity and accessibility
Transport analysis shows 29 active stops operating in Charles, offering a mix of bus services. These stops are served by 8 unique routes, collectively facilitating 470 weekly passenger trips. Transport accessibility is deemed good, with residents typically situated 224 meters from the nearest stop.
Service frequency averages 67 trips daily across all routes, equating to roughly 16 weekly trips per individual stop.
Frequently Asked Questions - Transport
Transport Stops Detail
Health
The level of general health in Charles is notably higher than the national average with both young and old age cohorts seeing low prevalence of common health conditions
Charles demonstrates above-average health outcomes, with both young and old age cohorts experiencing low prevalence of common health conditions.
The rate of private health cover is approximately 54% of the total population, which totals around 2,527 people. Mental health issues and asthma are the most common medical conditions in the area, affecting 6.8% and 6.7% of residents respectively. Around 73.8% of residents declare themselves completely clear of medical ailments, compared to 76.9% across Rest of NT. The area has approximately 10.1% of residents aged 65 and over, totaling around 473 people. Health outcomes among seniors are above average, broadly in line with the general population's health profile.
Frequently Asked Questions - Health
Cultural Diversity
The level of cultural diversity witnessed in Charles was found to be slightly above average when compared nationally for a number of language and cultural background related metrics
Charles was found to have a higher cultural diversity than most local markets, with 21.1% of its population born overseas and 22.9% speaking a language other than English at home. The predominant religion in Charles is Christianity, comprising 44.7% of the population. Notably, the 'Other' category comprises 1.9% of Charles's population, slightly higher than the Rest of NT average of 2.1%.
In terms of ancestry, the top three groups are English (20.6%), Australian (20.3%), and Australian Aboriginal (20.2%), which is lower than the regional average of 28.9%. Some ethnic groups show notable differences: Maori are overrepresented at 1.0% in Charles compared to 1.1% regionally, Filipino at 1.9% versus 1.7%, and Samoan at 0.3% versus 0.4%.
Frequently Asked Questions - Diversity
Age
Charles's population is younger than the national pattern
Charles's median age of 35 is higher than the Rest of NT figure of 31 but lower than Australia's median age of 38. Compared to Rest of NT, Charles has a higher proportion of residents aged 55-64 (12.3%) but fewer residents aged 15-24 (11.5%). Between 2021 and the present, the 0-4 age group has increased from 6.6% to 8.0%. Conversely, the 55-64 age cohort has decreased from 13.3% to 12.3%. By 2041, demographic projections show significant changes in Charles's age structure. The 45-54 age cohort is projected to increase by 105 people (19%) from 566 to 672. Meanwhile, the number of residents aged 35-44 is expected to decrease by 19.
