1 Proposed169applications in assessmentLeading · to August 2026See applications ↓
2 Approved338dwellings approved in 2025-26, or 0.74 per 100 existing dwellings a yearOfficial · ABS to August 2026See approvals ↓
3 Building33major projects committed or under construction, 15 of them already on siteForward · completions to 2030+See projects ↓
4 Delivered1,643new addresses verified since the 2021 Census, up 7.2% on the existing baseActual · to August 2026Where it landed ↓
In the 2025-26 financial year the ABS recorded 338 dwelling approvals across Adelaide City. Right now, 169 development applications are lodged in the Adelaide local government area. AreaSearch tracks 33 major projects here that are committed or under construction, the largest being SA Water Capital Work Delivery Contracts 2024-28 at an estimated $3.30bn. On the ground, 1,643 new addresses have been verified since the 2021 Census — growth of 7.2% on the existing address base.
These four figures are deliberately not added together. An application, an
approval and a project under construction are often the same building at three points in its life,
measured by three different bodies with three different lags. Read them as a sequence, not a total.
ApprovedBuilding Approvals in Adelaide City
What councils and certifiers have formally
permitted — the ABS series, published about four months in arrears.
Approvals are running at 0.74 per 100 existing dwellings a year, in line with the South Australia rate of 0.78. Recent approvals are dominated by attached housing — apartments, townhouses and other non-detached dwellings make up 98% of them. Detached houses make up 9% of the homes already standing here but only 4% of the past five years of approvals, so the area is densifying. The average approved dwelling is valued at $561,000 in construction cost.
For its size, Adelaide City is adding 0.74 dwellings a year per 100 existing homes — in line with the South Australia rate of 0.78 and the national rate of 0.71. That is about 10.5 approvals a year for every 1,000 residents. Building intensity has fallen by about 68% across the published series.
Measured against people rather than housing stock, Adelaide City is approving 11.20 dwellings a year per 1,000 residents — above the South Australia rate of 7.94. The two rate views differ by household size, which here averages 2.3 people per home. Housing the projection to 2041 would need about 3.01 per 1,000 residents a year.
Dwelling approvals a year per 100 existing
homes, with South Australia and Australia for comparison. This is the
same activity as the totals view, divided by the size of the area — which is the only
fair way to compare a large SA3 with a small one.
Dwelling approvals a year per 1,000
residents, each year divided by that year’s estimated resident
population (ABS ERP at 30 June), not by today’s — which matters most in fast-growing
areas, where a fixed denominator can understate the early years by half. The most recent periods use the latest published ERP, as the population series runs a year behind approvals. Read it alongside the per-100-homes view: the two differ wherever household size does.
Dwelling units approved each financial year. The dashed line is the five-year average of 324.
How intensively is it building?
Dwelling approvals a year per 100 existing dwellings.
Adelaide City0.74
South Australia0.78
Australia0.71
What is here, and what is coming
Detached houses as a share of existing homes,
against the share of recent approvals.
Existing homes (2021 Census)9%
Approved, last 5 years4%
Approved, latest year2%
Detached housesApartments, townhouses & other
Approvals mix by year
Share of each year’s approvals.
2023
2024
2025
2026
2025-26
$220m
Residential work approved
2025-26
$1.01bn
Commercial work approved
construction cost
$561,000
Average value per approved dwelling
last two years
183
Residents per approval
Supply & DemandIs Adelaide City Building Enough Homes?
The same approvals, measured against the population
they have to house.
Adelaide City approves about 10.5 new dwellings a year for every 1,000 residents. Since the 2021 Census it has added 5,829 residents but only 1,643 new addresses — about 3.5 extra people for every home built, against an average household of 2.3. On those numbers supply has not kept pace with growth. Housing the population projected for 2041 implies roughly 93 new dwellings a year from here, which puts the recent approval rate of 324 a year comfortably ahead of what the projection needs.
Growth against supply since the Census
People added for every new address verified,
against the size of an average local household.
People added per new home3.5
Average household size2.3
A bar longer than the household average means
the area gained more residents than its new housing could hold, and the extra had to be
absorbed by existing homes.
Approval rate against projected need
Dwellings a year: what is currently being
approved, against what the 2041 population projection implies.
Approved (5-yr average)324
Implied need to 204193
Implied need assumes the average household stays
at today’s 2.3 people. Approvals are not
completions, and not every approval is built.
What is being asked for right now — applications
collected from council planning portals, before any of it reaches the ABS series above.
AreaSearch tracks applications of material scale; routine minor works such as signage and
fencing changes are not carried, so these are not counts of every application lodged. 21
of them carry an AreaSearch analyst assessment — look for the
Analysed marker in the search below.
AreaSearch tracks 10,576 development applications of material scale lodged with council across Adelaide City, the most recent in August 2026. The biggest categories in the queue by value are commercial, mixed-use and multi-residential. Live applications account for about 106 proposed dwellings.
Estimated value of applications by development type. This is the clearest
single picture of what kind of place Adelaide City is being asked to become. A further 256 applications sit across
4 smaller categories,
too few to plot.
Where the applications stand
As reported by the council. Highlighted rows are
applications still in assessment.
Development Approval Granted3,340
Completed2,317
Development Approval1,193
Decision Made858
Planning Consent Granted684
Consent343
191 applications are still marked under
assessment but were lodged more than
18 months ago. Councils often leave determined or
abandoned applications open in their feeds, so
they are counted here but excluded
from the live queue above.
A further 1 application carry no status in the council feed.
By local government area
Applications on record within each council area that
overlaps Adelaide City. This counts applications inside this
statistical area only — it is not a total for the council.
Adelaide10,576
Recent applications on record in Adelaide City
Nothing in Adelaide City is currently both open and lodged within the last 18 months, so these are the largest on record, lodged between Jul 2008 and Nov 2020. They are a record of past activity, not a live queue. By estimated cost of works, as lodged. Estimates are the applicant’s own figures and are not verified by AreaSearch.
Vary previous authorisation to construction of 22 level residential tower with ground floor commercial and associated car parking - VARIATION…Adelaide · Development Approval Granted · lodged Dec 2016
$270m
Demolition of existing building and construction of mixed use development comprising 5 level retail/carpark podium, 38 level (including podium)…Adelaide · Planning Consent Granted · lodged Nov 2020
$240m
Demolition of existing structures and the construction of a mixed use building accommodating a Proton Therapy Unit and associated uses in basement…Adelaide · Development Approval Granted · lodged Sep 2020
$239m
Demolition works and the construction of a car park over 5 basement levels a 27 level office tower (including ground level retail two levels of plant…Adelaide · Planning Consent Granted · lodged Mar 2016
$230m
Construct 9 level addition to the north of the existing casino building containing hotel entry, gaming and cafes (Plaza level) gaming and restaurants…Adelaide · Planning Consent Granted · lodged Nov 2015
$175m
The demolition of all buildings on site with the exception of the State Heritage Place at 64 King William Street (Sands & McDougall building), and…Adelaide · Planning Consent Granted · lodged Jul 2020
$160m
Partial demolition of a State Heritage place and conversion to a hotel; construction of a mixed use development comprising retail, consulting rooms…Adelaide · Comments Provided to SCAP · lodged Nov 2015
$150m
Demolish existing buildings and construct a 19 storey building comprising 4 storeys of retail (including basement) and 15 storeys of office…Adelaide · Substantially Commenced · lodged Jul 2008
$150m
BuildingFORWARDMajor Projects & Infrastructure in Adelaide City
What is funded and moving — the projects large enough
to change how Adelaide City works, ranked by committed value and how close
they are to delivery.
AreaSearch tracks 33 current projects across Adelaide City. The largest is SA Water Capital Work Delivery Contracts 2024-28 at an estimated $3.30bn, due by 2028. That breaks down as 15 under construction, 8 approved and awaiting a start and 10 still in planning. The pipeline is weighted toward residential development, tourism and communities, precincts & urban renewal.
Under construction$600mby 2026
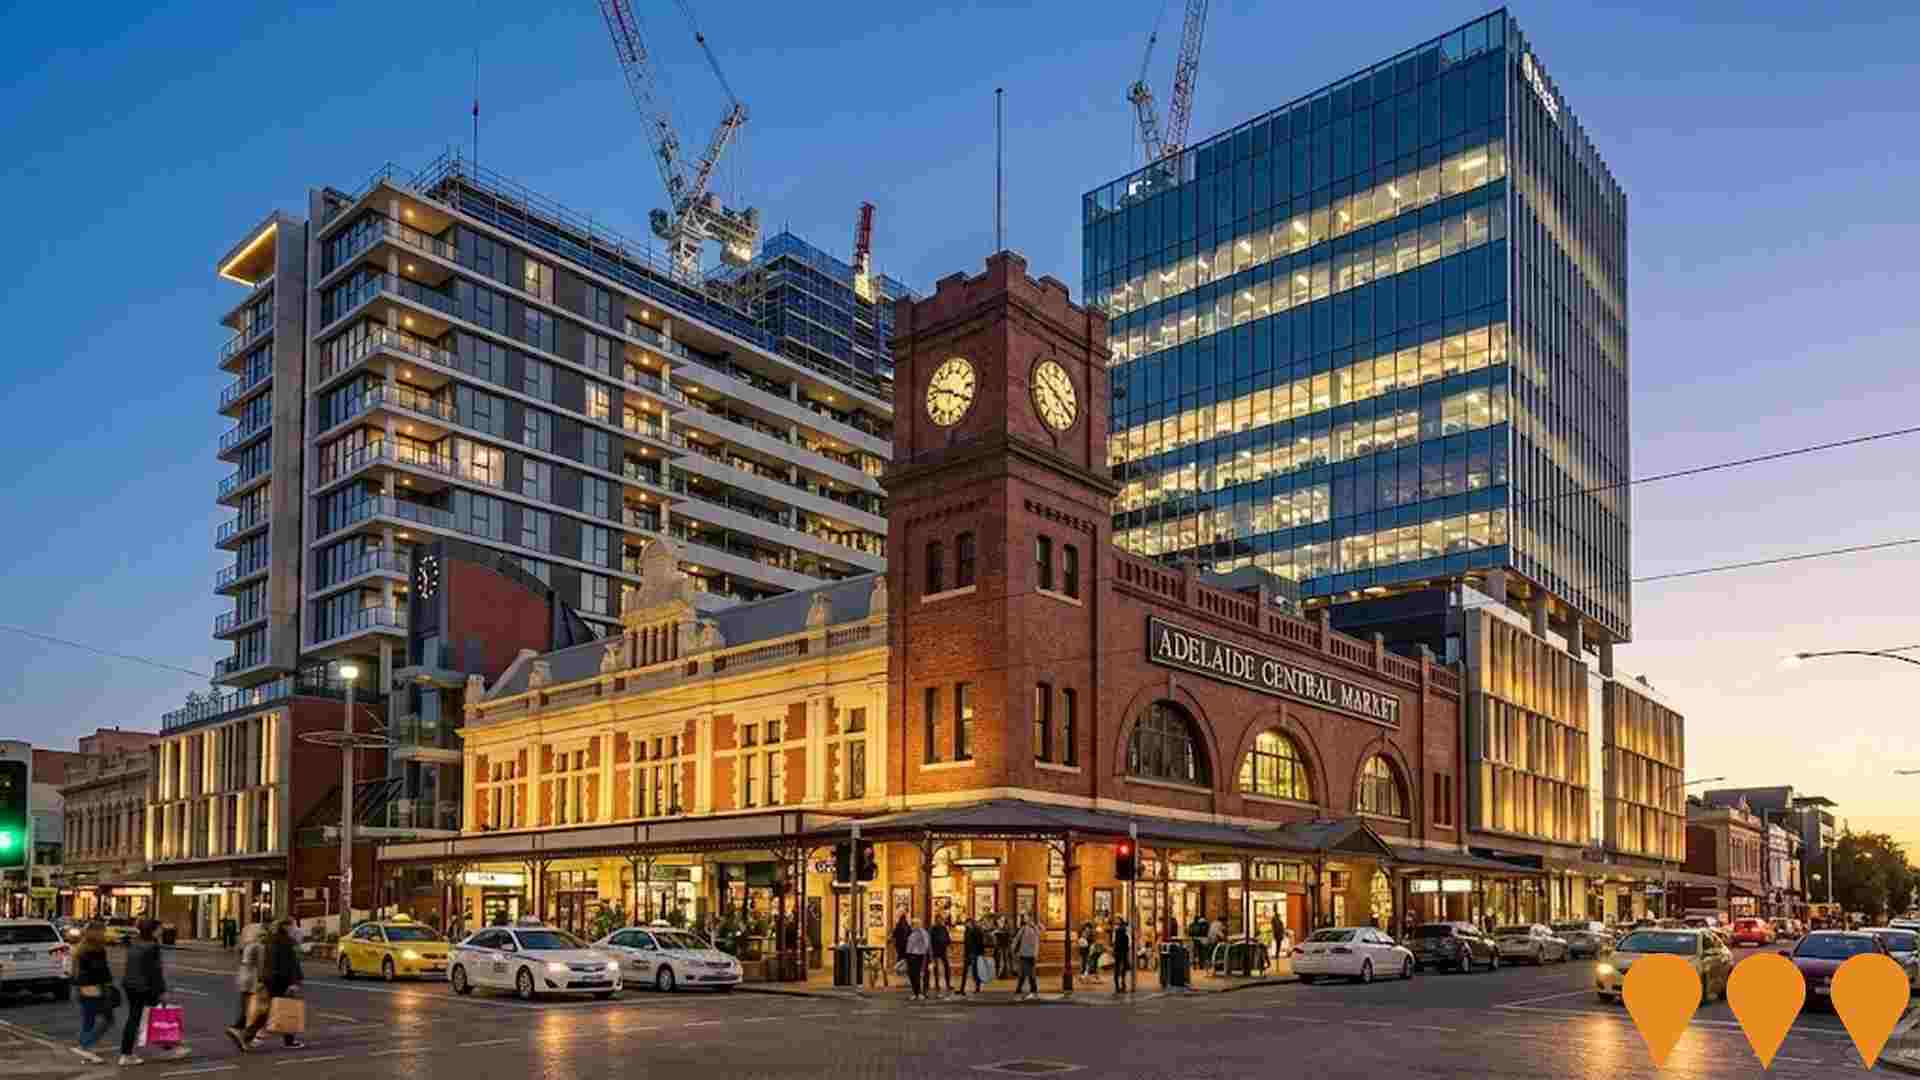
Market Square and Central Market Expansion
Major mixed-use redevelopment of the former Central Market Arcade by ICD Property in partnership with the City of Adelaide. The project is under construction and will expand Adelaide Central Market, add a…
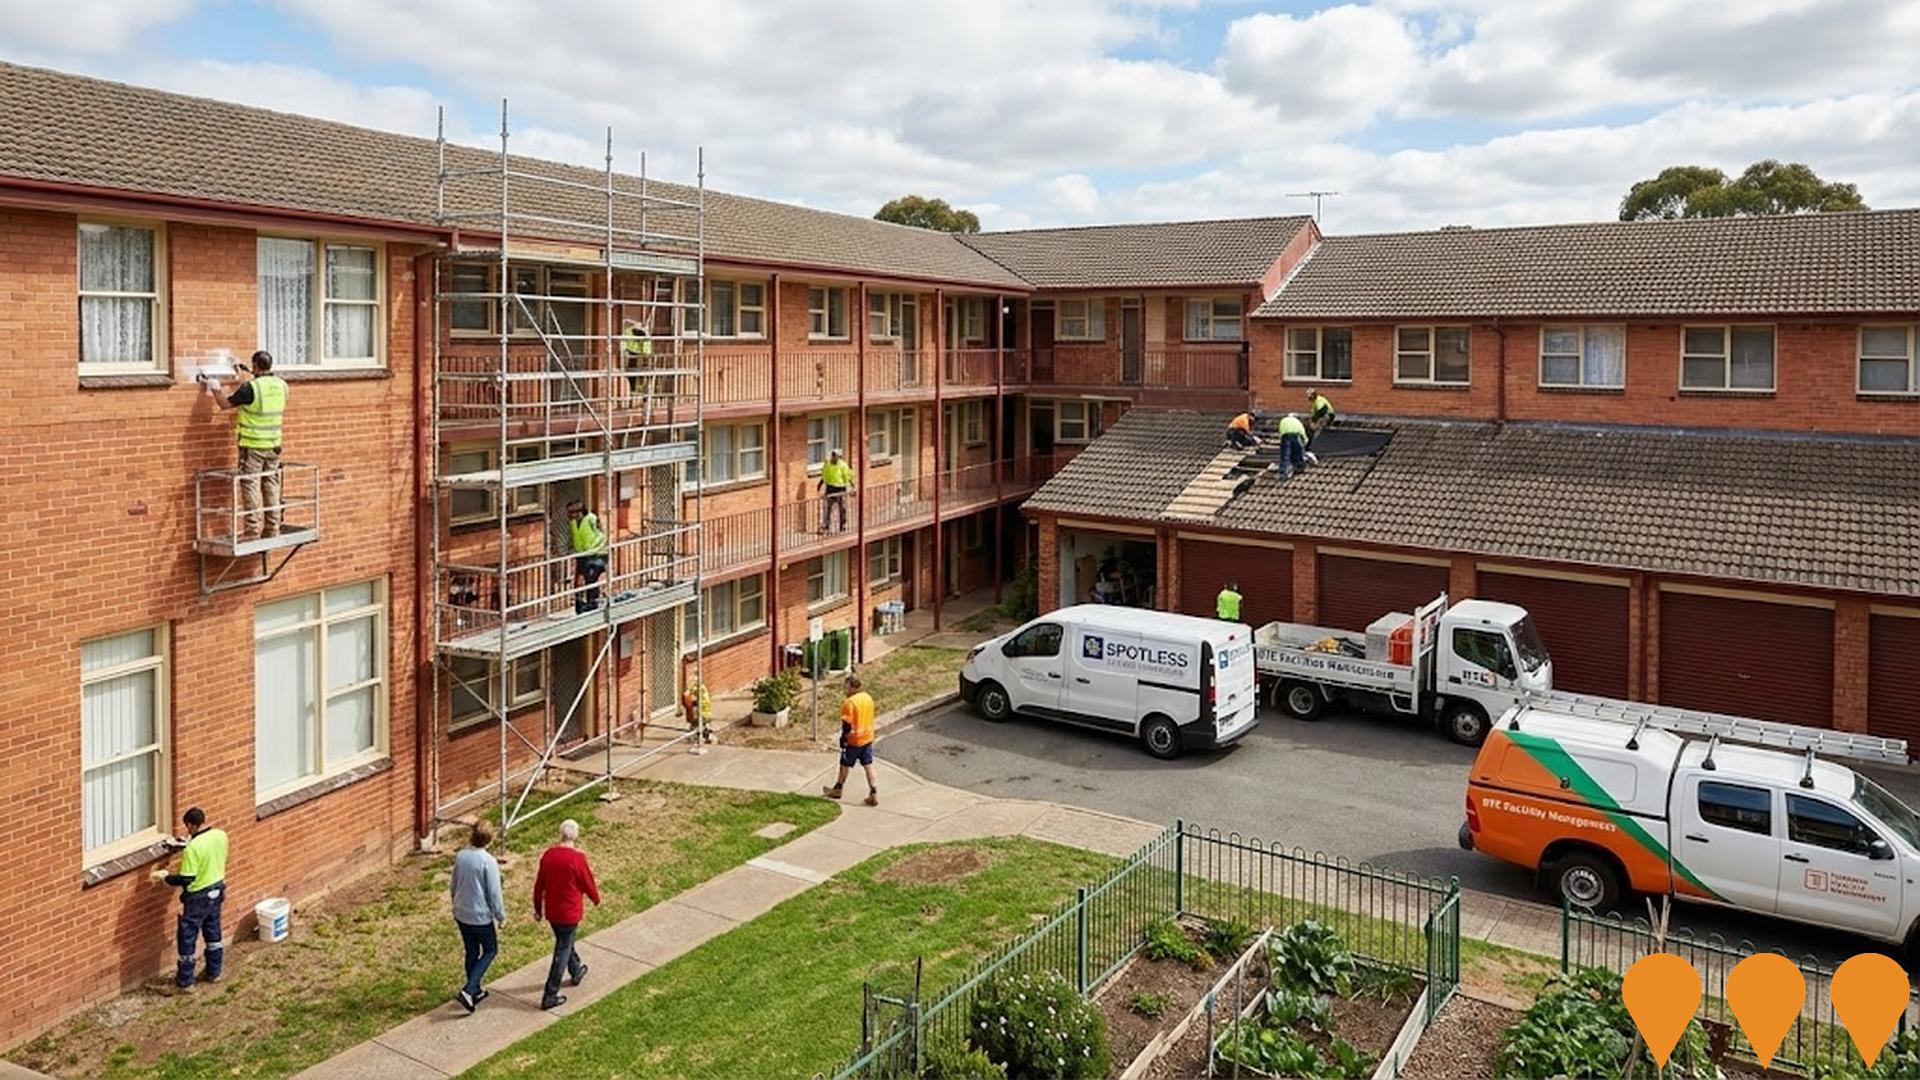
SA Housing Trust Maintenance Contracts Review and Service Program
Statewide maintenance and service contracts for SA Housing Trust public housing properties, covering reactive maintenance, vacancy restoration and minor works across metropolitan and regional South Australia…
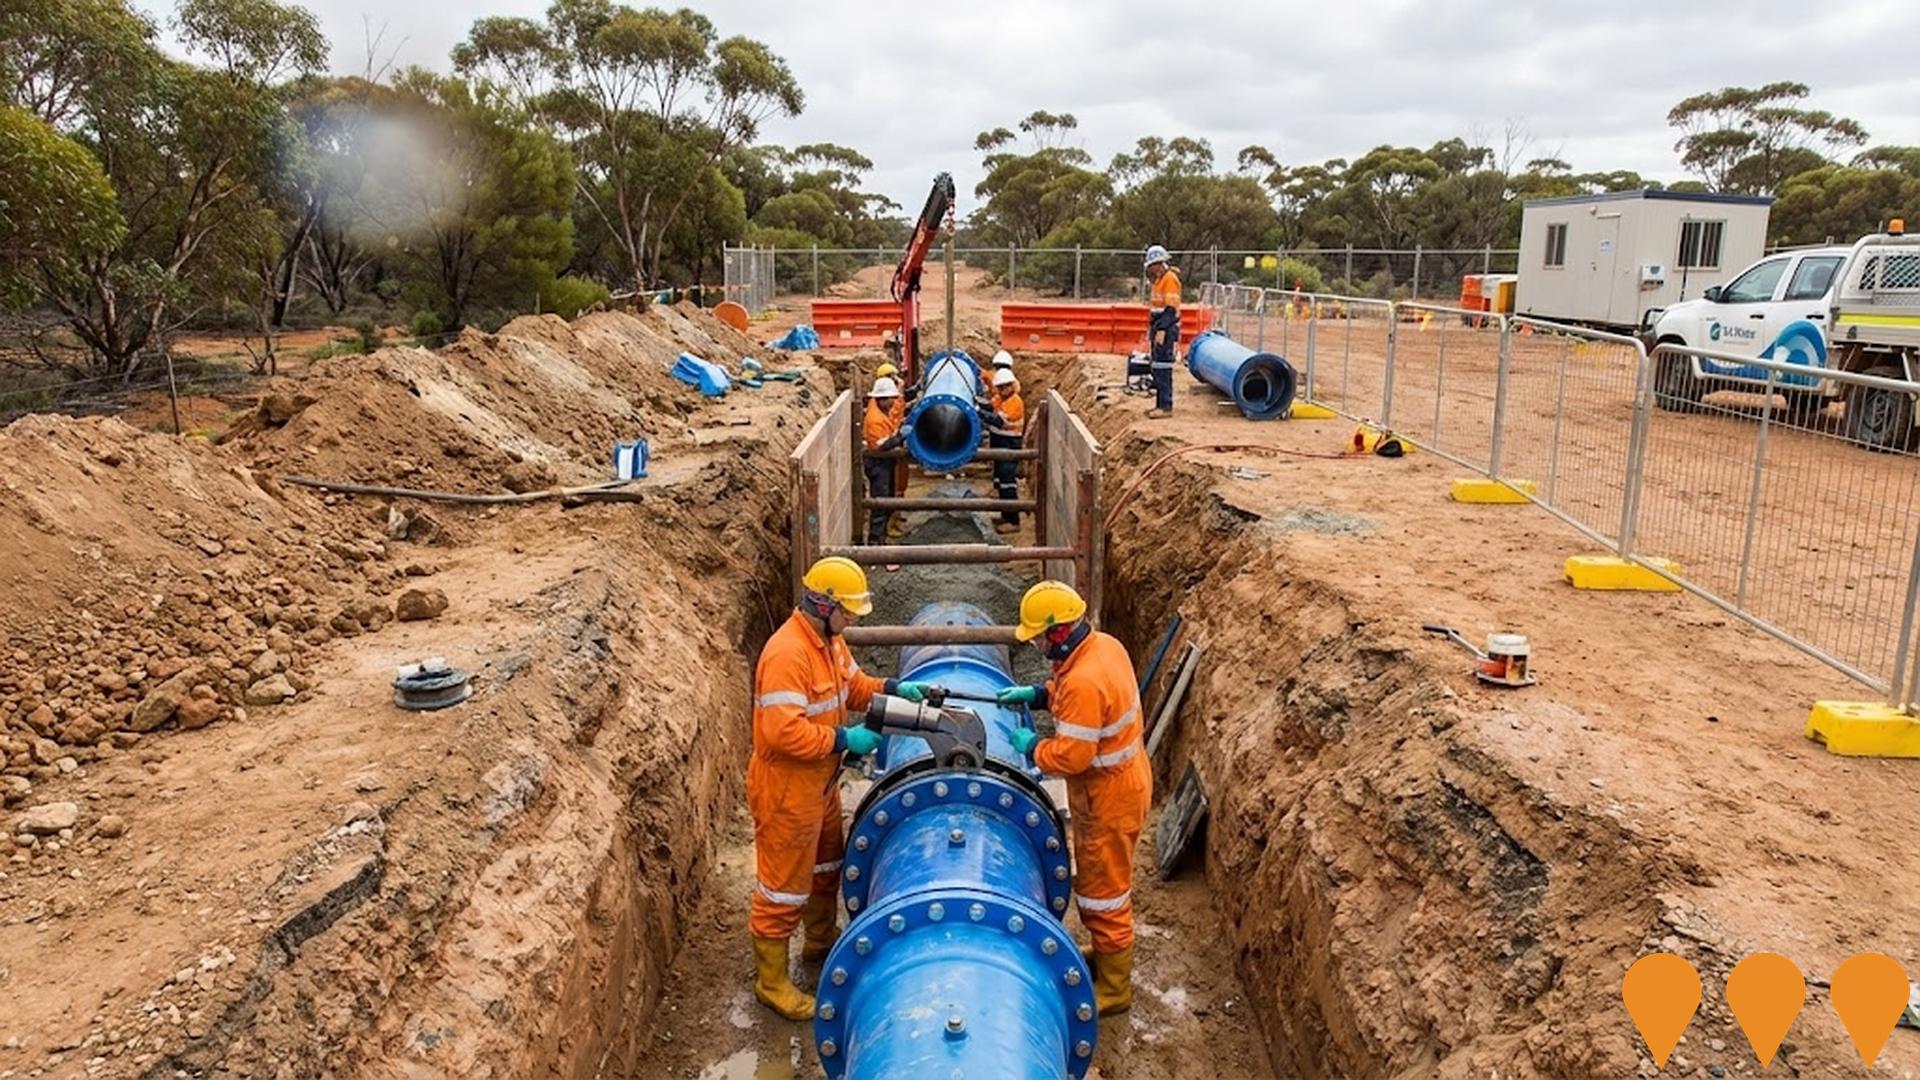
SA Water's record $3.3 billion capital delivery program for the 2024-28 regulatory period, covering water and wastewater infrastructure across South Australia. The program targets water main replacements…
Lot Fourteen Innovation PrecinctUnder construction · Science & Research · by 2028 · Adelaide
$2.20bn
Festival Tower TwoUnder construction · Precincts & Urban Renewal · by 2029 · Adelaide
$1.00bn
88 North Terrace (Holy Trinity Church Student Accommodation)Under construction · Education & Training · by 2028 · Adelaide
$450m
Keystone TowerUnder construction · Tourism · by 2027 · Adelaide
$400m
New Women's and Children's HospitalUnder construction · Health & Medical · by 2031 · Adelaide
$3.20bn
Arcadia, AdelaideApproved · Residential Development · by 2028 · Adelaide
$350m
Crystalbrook SamUnder construction · Tourism · by 2026 · Adelaide
$130m
Crown and Anchor Student AccommodationUnder construction · Education & Training · by 2027 · Adelaide
$120m
Bowden Urban Renewal ProjectUnder construction · Communities, Precincts & Urban Renewal · by 2035 · North Adelaide
$1.00bn
Adelaide Level Crossing Removal Planning ProgramApproved · Transport & Logistics · by 2030 · Adelaide
$500m
Amora Hotel Adelaide RedevelopmentUnder construction · Tourism · by 2027 · Adelaide
$73m
Little National Hotel AdelaideUnder construction · Tourism · by 2026 · Adelaide
$62m
18 further projects in
Adelaide City are not listed here.
Combined values on this page exclude
4 records that appear to be
separate stages of a project already counted. Both are still listed
above with their own values.
Denotes AI-based impression for illustrative purposes only, not to be taken as
definitive under any circumstances. Please follow links and conduct other
investigations from the project’s source for actual imagery. Developers and
project owners wishing us to use original imagery please Contact
Us and we will do so.
Beyond 2030:
a further $5.86bn across
4 projects with completion dates further out — mostly precinct-scale programs whose dates are
indicative. Kept out of the chart so the years you can act on stay readable.
Estimated value of tracked projects by the year they are due to
complete, stacked by how certain they are. The dark band is money already being spent;
the pale band is still an intention. Estimates are indicative and mix infrastructure
cost with whole-of-precinct development value, so read the shape rather than the totals.
Approvals PipelineDevelopment Applications in Adelaide City
Development applications around
Adelaide City
Development approvals is a new addition to AreaSearch.
We’re actively expanding council coverage and refining the dataset — details and statuses for some councils may be partial. Check back regularly for the latest pipeline.
Applications
—
In the local catchment
Est. Value
—
Where disclosed
Under Assessment
—
Awaiting determination
Determined
—
Approved or decided
Approvals pipelineStatus, location, timing and project scale
Loading development applications…
Lodged
Address
Description
Type
Distance
Status
SOURCE: Planning portals and council registers, compiled by AreaSearch. Distance & bearing measured from the suburb midpoint.
ProfessionalPRODevelopment Map for Adelaide City
Applications and major projects plotted where
they are actually proposed, with the
41 projects AreaSearch tracks here on their own tab — filterable by type, delivery stage,
area and committed value. To search every application on record rather
than this sample, use the section above.
DistributionWhere Development Is Happening in Adelaide City
Adelaide City covers 2 statistical areas. Follow any of them through for a full profile of population, housing, sales and amenity at local scale.
Map builder
Each area below opens a map builder on its own page — a tool for
putting a map and a table into a report. Pick the place types you want plotted
(schools, supermarkets, medical, child care, transport and the rest of what
AreaSearch holds), add development applications as their own layer, drop your own
points, then recolour, renumber and export the result as a table or CSV.
A this area only toggle clips everything to the boundary you are looking at.
Searches are charged against your credit balance — 1 credit per 40
results from AreaSearch data — and setting filters costs nothing until
you search. The builder works on one suburb-sized area at a time, which is why it
opens per area rather than across the whole of
Adelaide City.
Planning AuthoritiesCouncils Covering Adelaide City
Development in Adelaide City is assessed within the Adelaide local government area. AreaSearch publishes development
figures at ABS statistical boundaries rather than council boundaries. That is deliberate: the ABS
issues a separate official building-approvals series for local government areas, and totals
built up from statistical areas would not match it. Reporting at SA3 keeps every figure on this page
reconcilable with the published ABS series.
CompareNearby Development Hubs
The same view of building approvals, applications and
major projects for areas neighbouring Adelaide City.
Collected from council planning portals. The
earliest signal available, but the least certain: many applications are amended,
withdrawn or refused, values are the applicant’s own estimate, and coverage
varies by council. This is a curated set, not the full council feed:
AreaSearch carries applications of material scale and does not track routine minor
works such as signage, fencing or small alterations, so the counts here are lower
than a council’s own total lodgement figure and should not be compared with it. Applications still shown as under assessment more than
18 months after lodgement are reported separately
and kept out of the live-queue figures: the age profile of open applications is
sharply split between a genuine queue under a year old and a long tail of records
councils never closed. Not every state publishes a cost of works — Queensland,
the Northern Territory and the ACT publish none at all — so on those pages
applications are counted rather than valued and no dollar figure is shown
rather than a partial one. Treated here as a snapshot of the current queue only —
AreaSearch does not chart application counts over time, because the history
reflects when each portal was collected rather than when development happened.
Approved — ABS building approvals
The official series, aggregated to SA3 from
ABS building approvals data, currently published to August 2026.
Counts dwelling units approved, not buildings and not completions. The most recent
financial year is annualised from nine months of data wherever it appears and is
labelled as such.
Building — major projects
Projects tracked individually by AreaSearch
from Infrastructure Australia, state infrastructure agencies, developer disclosures
and council records. Values are estimates and delivery dates are targets. Ranked on
this page by committed value and delivery stage rather than by distance.
Delivered — verified new addresses
New residential addresses verified in the national
address register since the 2021 Census. This is the closest available measure of what has
actually been built, though address creation can lead occupation and lags
construction. It is not a completions count.
Boundaries
Adelaide City is Statistical Area Level 3 40101 in the ABS Australian Statistical Geography Standard (2021 edition), made up of 2 Statistical Areas Level 2.
It has an estimated 30,855 residents, +23.3% since the 2021 Census.
Currency
Measure
Source
To
Dwelling approvals, five-year average
ABS / AreaSearch
July 2026
House share of approvals
ABS / AreaSearch
July 2026
Residents per approval
ABS / AreaSearch
July 2026
Value per approved dwelling
ABS / AreaSearch
July 2026
Commercial work approved
ABS / AreaSearch
July 2026
Verified new addresses since the Census
Address register / AreaSearch
August 2026
Development applications
Council planning portals
August 2026
Major projects
Infrastructure Australia / state agencies / AreaSearch
Ongoing
Figures on this page are read live from the
AreaSearch database each time it loads, so they update as soon as a source does.
Development in Adelaide City — common questions
How many new dwellings were approved in Adelaide City?
The ABS recorded 338 dwelling approvals across Adelaide City in the 2025-26 financial year, against a five-year average of 324 a year.
How many development applications are lodged in Adelaide City?
AreaSearch tracks 10,576 development applications of material scale across Adelaide City — routine minor works such as signage and fencing are not included, so this is not a count of every application lodged, of which 169 remain in assessment. Applications are assessed within the Adelaide local government area. The most recent application in our data was lodged in August 2026.
What major projects are planned for Adelaide City?
AreaSearch tracks 33 current major projects in Adelaide City, 15 of them under construction. The largest include Market Square and Central Market Expansion, SA Housing Trust Maintenance Contracts Review and Service Program and SA Water Capital Work Delivery Contracts 2024-28.
Which council covers Adelaide City?
Adelaide City is an ABS Statistical Area Level 3. It is covered by the Adelaide local government area. AreaSearch publishes development figures at ABS statistical boundaries rather than council boundaries, so they reconcile with the official ABS series.
Is Adelaide City growing faster than the rest of South Australia?
On development approvals, Adelaide City is adding new dwellings at about the same rate as South Australia as a whole — 0.74 approvals per 100 existing dwellings a year against the state figure of 0.78.
How current is this development data?
ABS building approvals are published with a lag of roughly four months; this page carries the series to August 2026. Development applications are collected from council planning portals and refresh continuously, with the most recent application here lodged in August 2026. Major project records are reviewed on an ongoing basis. Each section carries its own currency label so the four are never confused.
Development data is provided for general information.
Estimated values, dwelling counts and delivery dates come from the lodging or delivering party and
are not independently verified by AreaSearch. Confirm anything material with the relevant council
or agency before relying on it.