Chart Color Schemes
This analysis uses ABS Statistical Areas Level 2 (SA2) boundaries, which can materially differ from Suburbs and Localities (SAL) even when sharing similar names.
SA2 boundaries are defined by the Australian Bureau of Statistics and are designed to represent communities for statistical reporting (e.g., census and ERP).
Suburbs and Localities (SAL) represent commonly-used suburb/locality names (postal-style areas) and may use different geographic boundaries. For comprehensive analysis, consider reviewing both boundary types if available.
est. as @ -- *
ABS ERP | -- people | --
2021 Census | -- people
Sales Activity
Curious about local property values? Filter the chart to assess the volume and appreciation (including resales) trends and regional comparisons, or scroll to the map below view this information at an individual property level.
Find a Recent Sale
Sales Detail
Population
An assessment of population growth drivers in Crestmead reveals an overall ranking slightly below national averages considering recent, and medium term trends
Crestmead's population was 12,975 as of November 2025, an increase of 817 people since the 2021 Census. The ABS reported an estimated resident population of 12,827 in June 2024, with an additional 114 validated new addresses contributing to the growth. This results in a population density of 1,861 persons per square kilometer, higher than the national average assessed by AreaSearch. Crestmead's 6.7% growth since the census is within 2.2 percentage points of the national average of 8.9%, indicating strong growth fundamentals. Natural growth accounted for approximately 60.8% of overall population gains in recent periods. AreaSearch uses ABS/Geoscience Australia projections for each SA2 area, released in 2024 with a base year of 2022.
For areas not covered by this data and years post-2032, Queensland State Government's SA2 area projections are adopted, released in 2023 based on 2021 data. However, these state projections lack age category splits, so AreaSearch applies proportional growth weightings from the ABS Greater Capital Region projections released in 2023 and based on 2022 data for each age cohort. Future population dynamics anticipate lower quartile growth, with Crestmead expected to expand by 401 persons to reach a total of 13,376 by 2041, reflecting an increase of 1.9% over the 17-year period.
Frequently Asked Questions - Population
Development
AreaSearch analysis of residential development drivers sees Crestmead recording a relatively average level of approval activity when compared to local markets analysed countrywide
Crestmead has seen approximately 23 new homes approved annually. Over the past five financial years, from FY-21 to FY-25, around 116 homes have been approved, with an additional 2 approvals so far in FY-26. On average, about 3.8 new residents arrive per year for each dwelling constructed during this period.
This has led to a significant outpacing of demand over supply, which typically exerts upward pressure on prices and intensifies competition among buyers. The average construction value of these new homes is $228,000, reflecting more affordable housing options compared to regional norms. In FY-26, $40.7 million in commercial approvals have been registered, indicating robust local business investment. Relative to Greater Brisbane, Crestmead has seen substantially reduced construction activity, with 89.0% below the regional average per person. This constrained new construction usually reinforces demand and pricing for existing dwellings, although there has been a recent intensification in construction activity.
The area's recent construction comprises 95.0% detached dwellings and 5.0% attached dwellings, preserving its suburban nature and attracting space-seeking buyers. With around 1383 people per dwelling approval, Crestmead reflects a highly mature market. According to the latest AreaSearch quarterly estimate, Crestmead is projected to add approximately 253 residents by 2041. At current development rates, new housing supply should comfortably meet demand, providing good conditions for buyers and potentially supporting growth beyond current population projections.
Frequently Asked Questions - Development
Infrastructure
Crestmead has strong levels of nearby infrastructure activity, ranking in the top 40% nationally
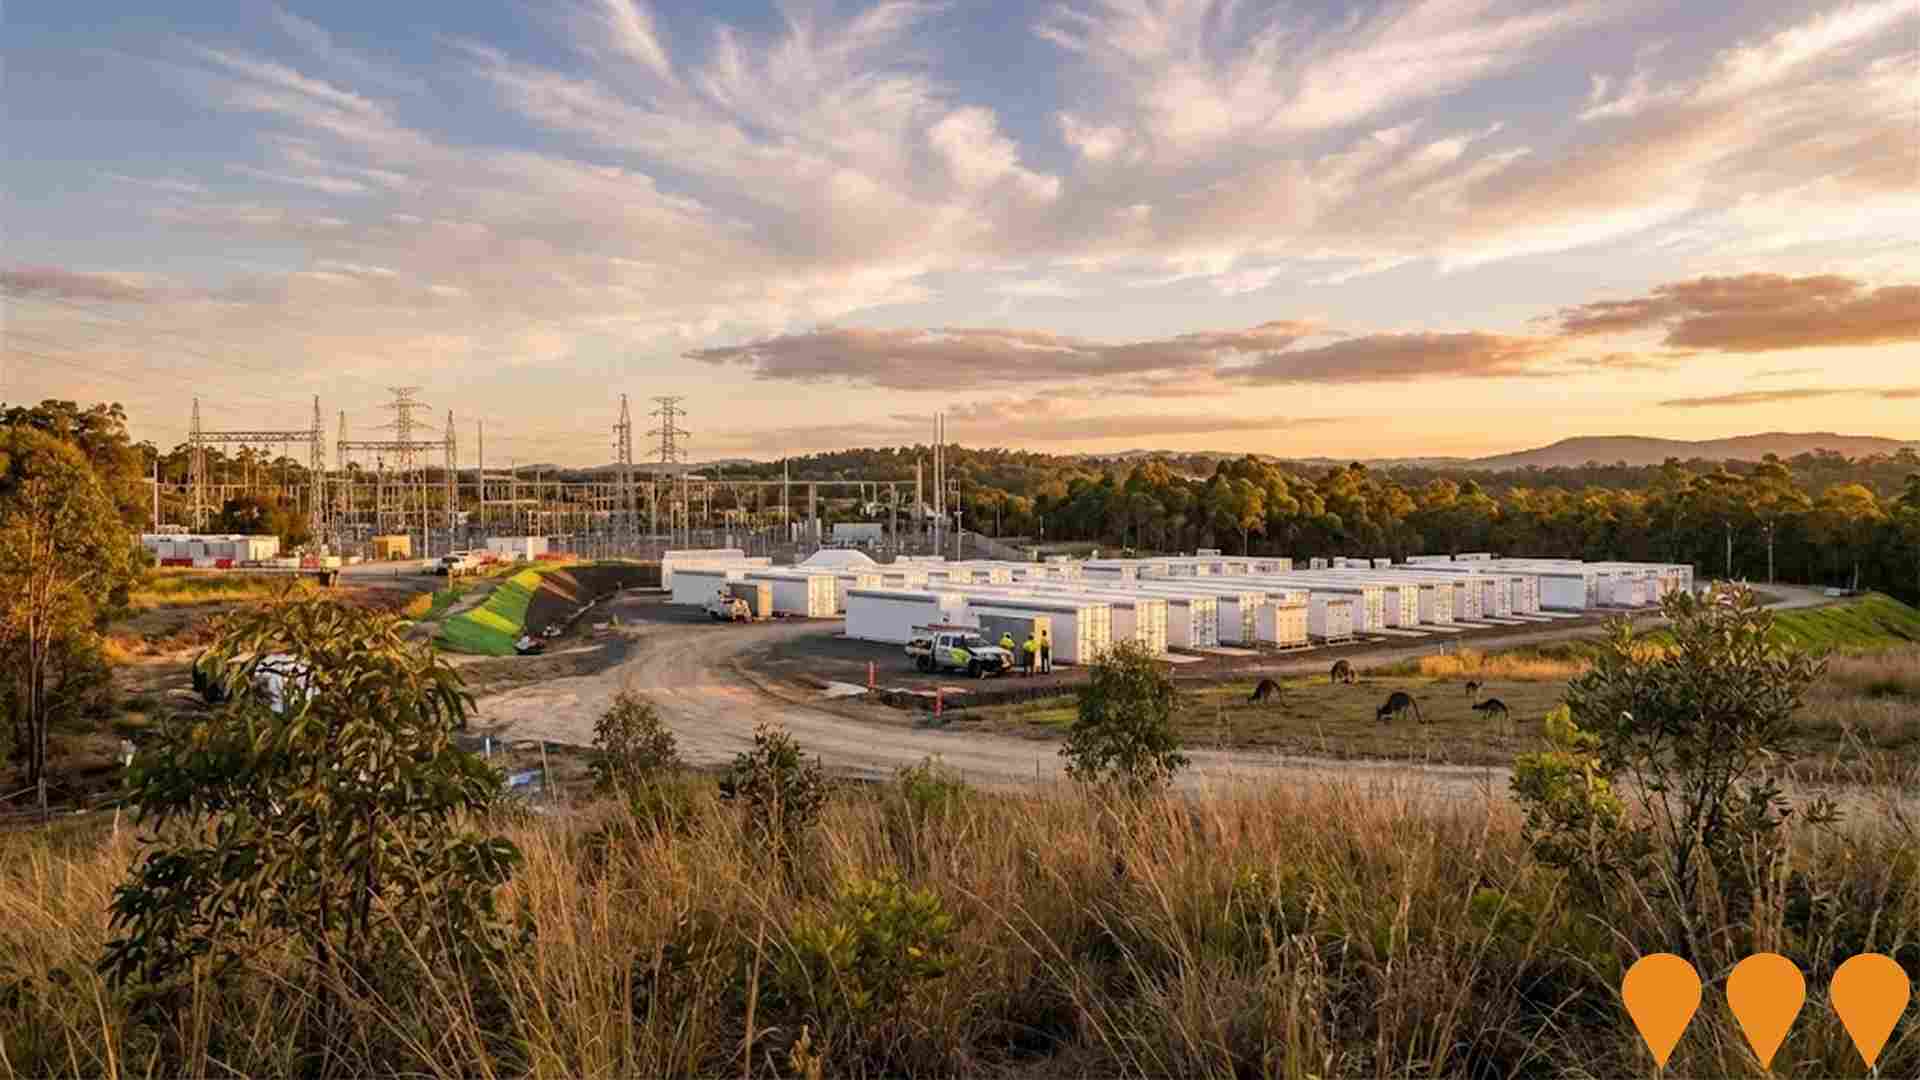
Changes to local infrastructure significantly affect an area's performance. AreaSearch has identified 13 projects likely to impact the area. Notable ones are Crestmead Logistics Estate, Logan Hospital Expansion, Greenbank Battery Energy Storage System, and Pan Pacific Recycling Solar Panel Facility. The following list details those most relevant.
Professional plan users can use the search below to filter and access additional projects.
INFRASTRUCTURE SEARCH
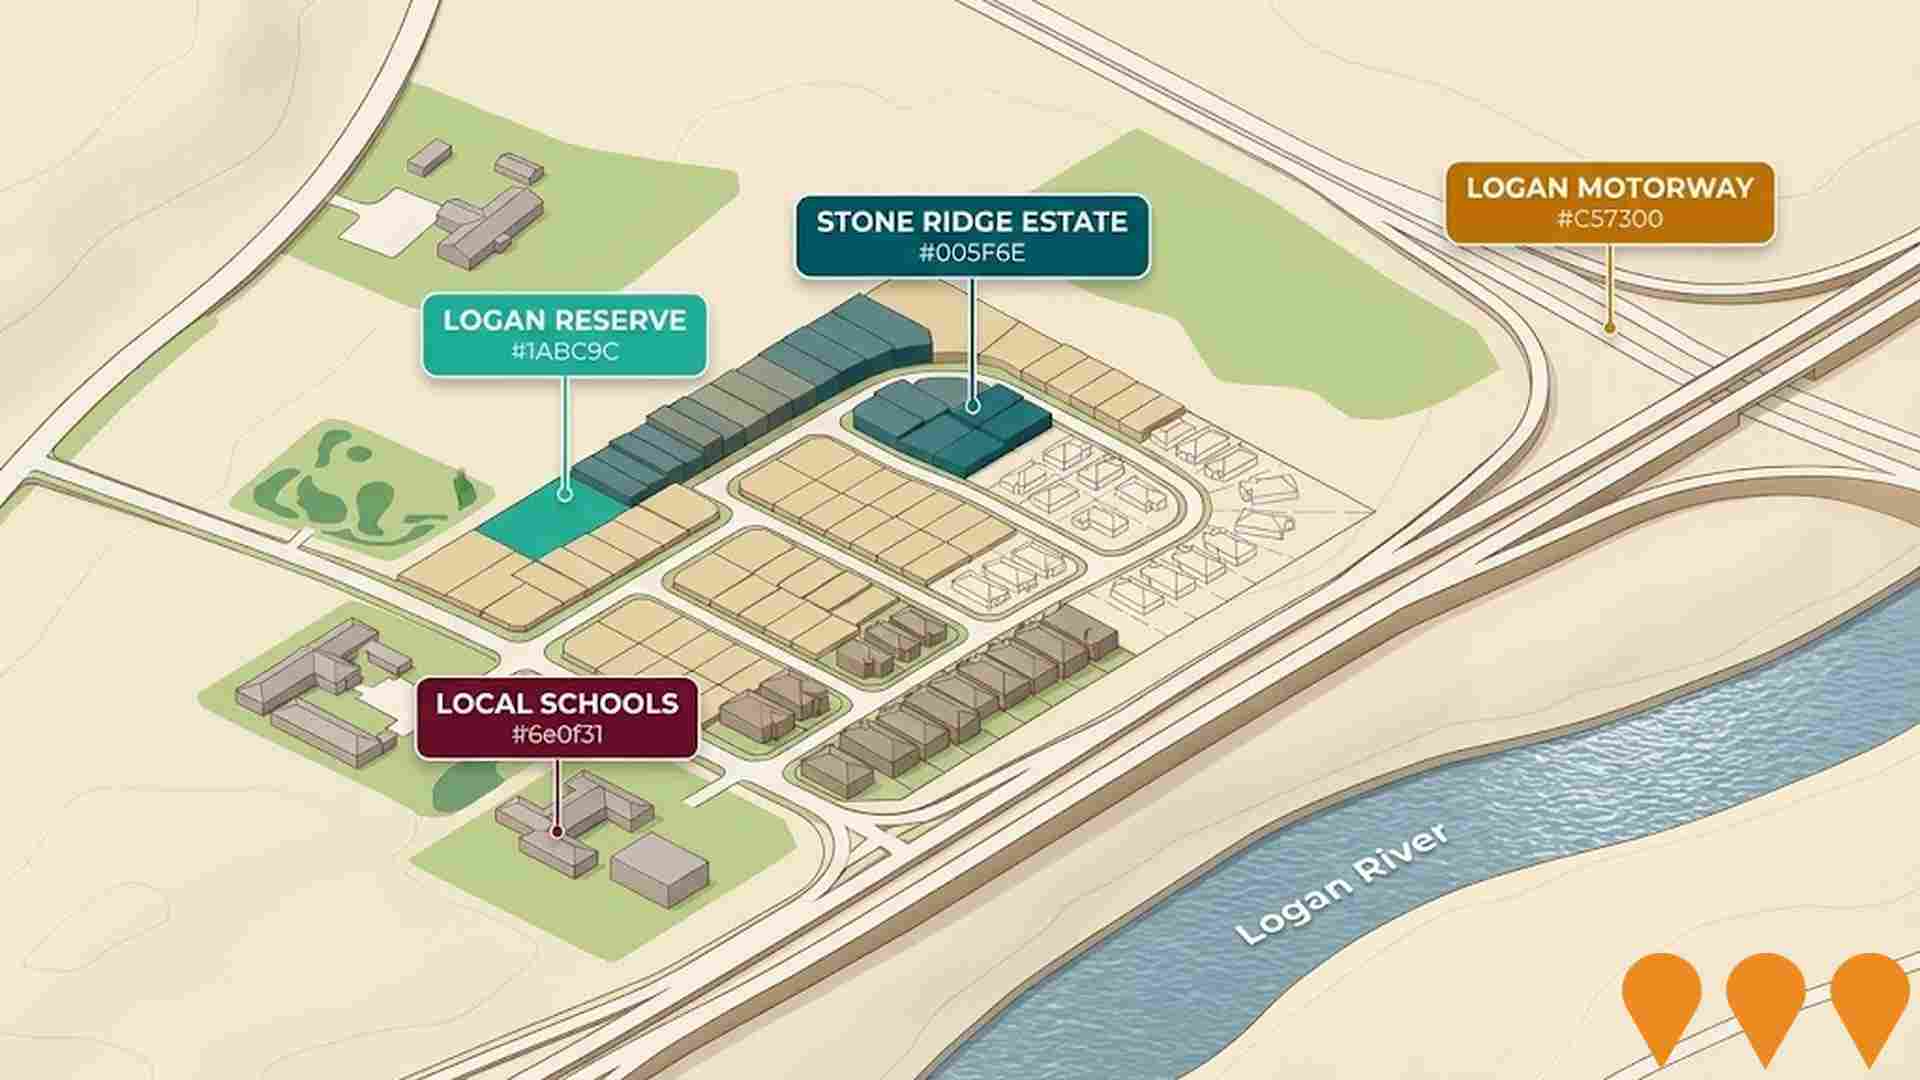
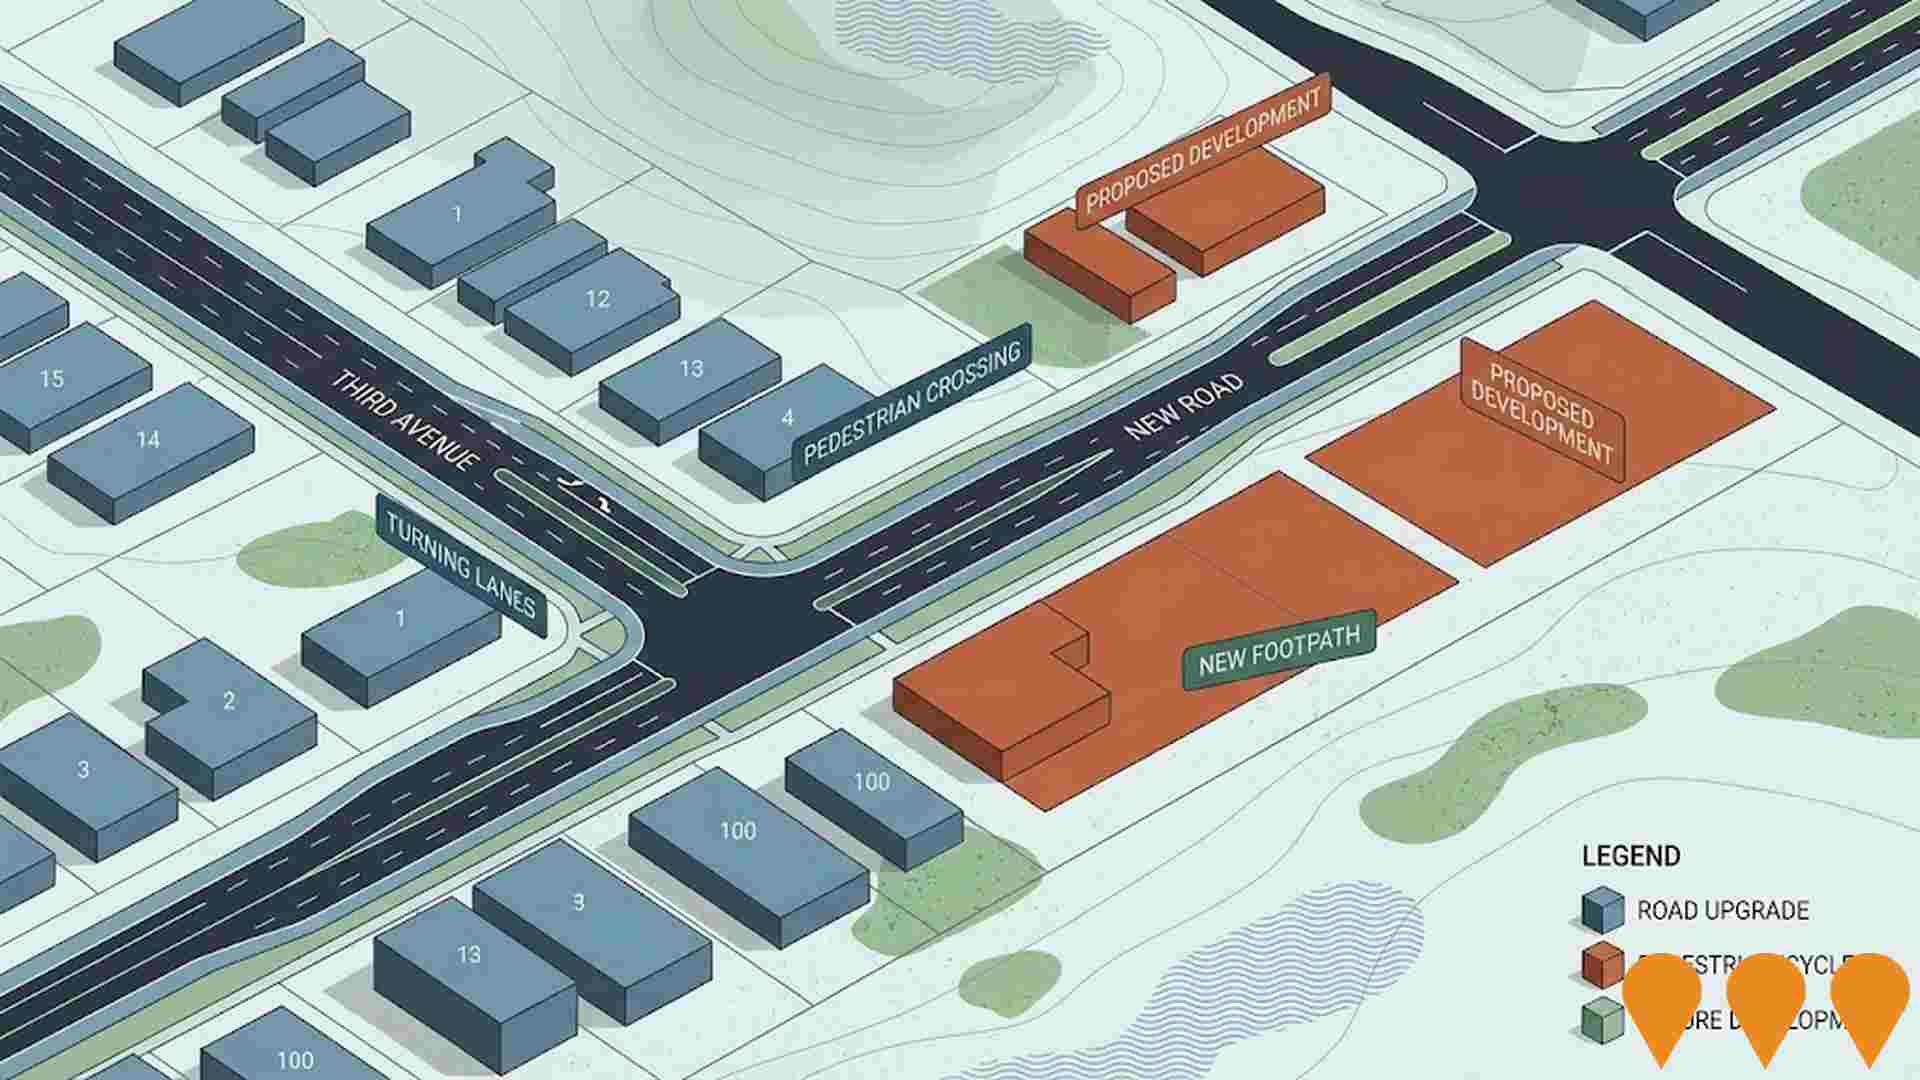
 Denotes AI-based impression for illustrative purposes only, not to be taken as definitive under any circumstances. Please follow links and conduct other investigations from the project's source for actual imagery. Developers and project owners wishing us to use original imagery please Contact Us and we will do so.
Frequently Asked Questions - Infrastructure
Queensland Energy Roadmap Infrastructure
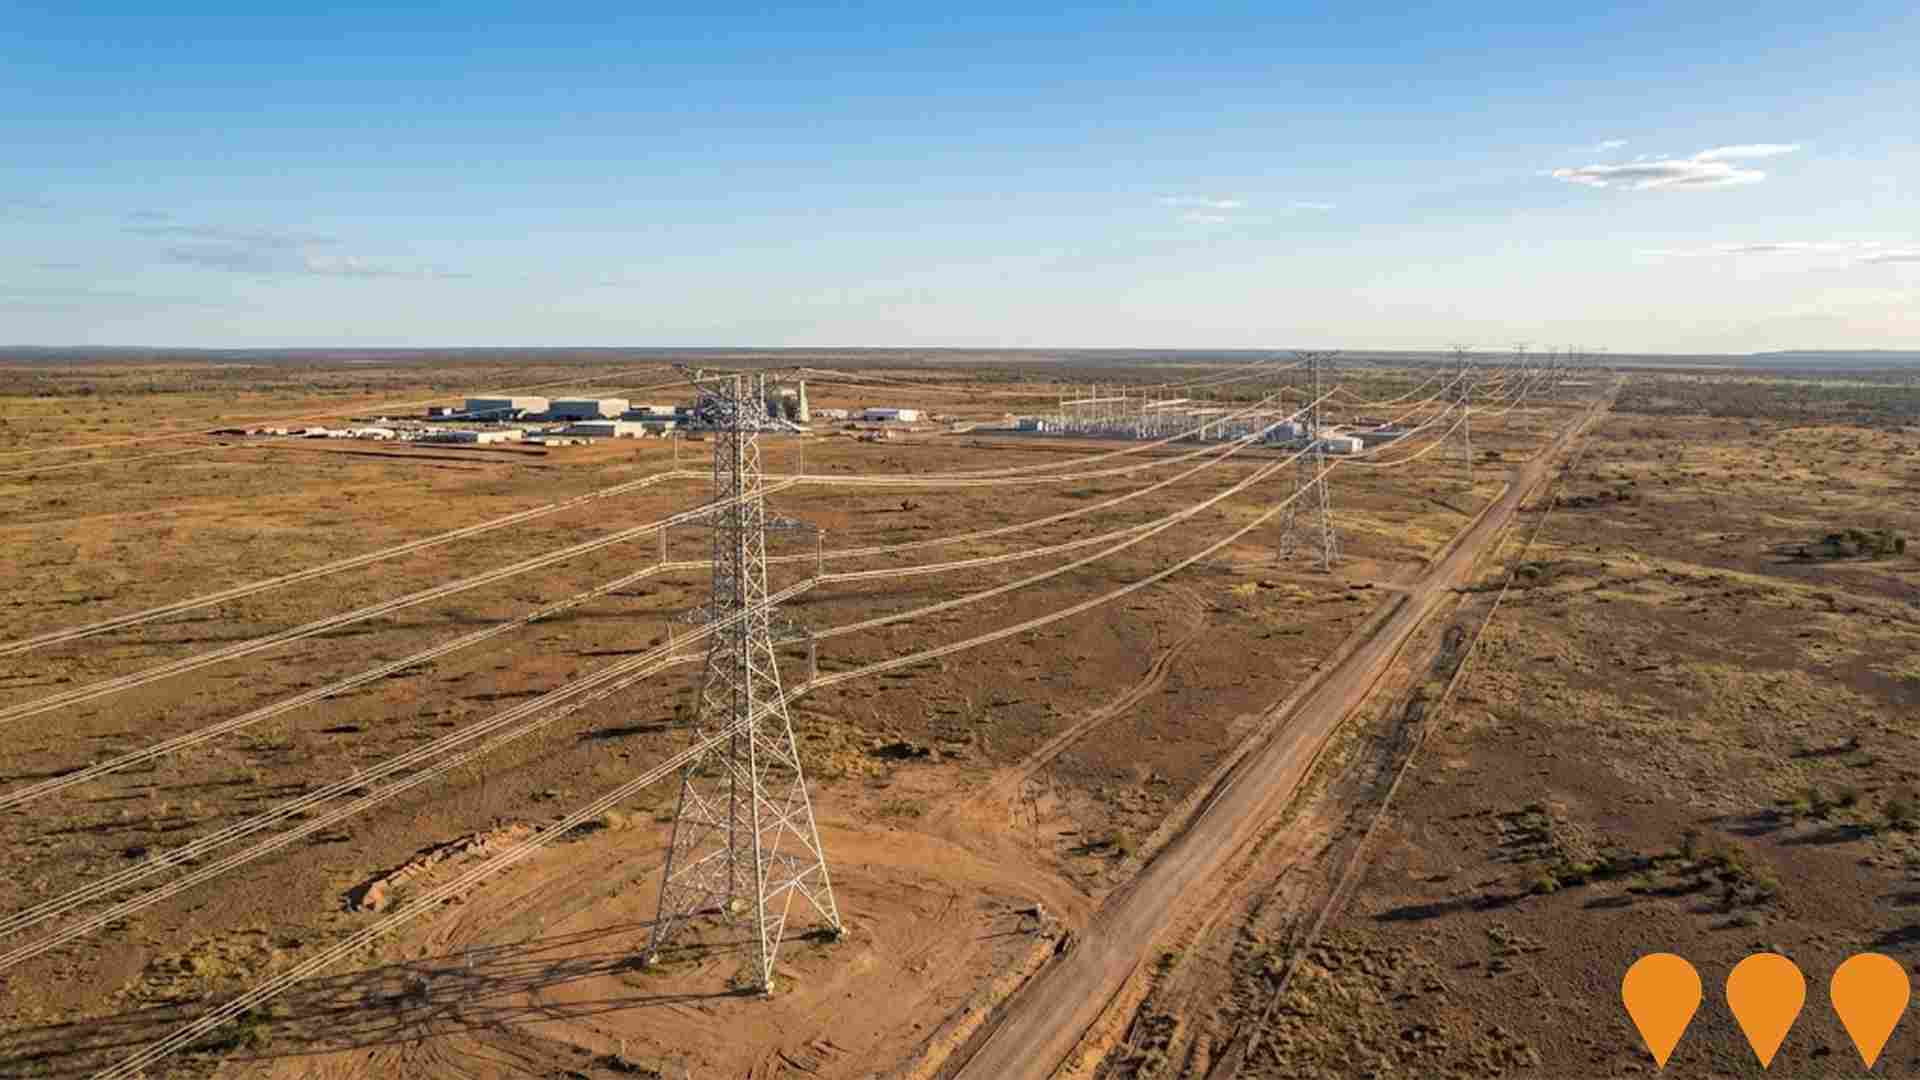
The Queensland Energy Roadmap 2025 is the State Government's strategic plan to deliver affordable, reliable, and sustainable energy. Replaces the former Energy and Jobs Plan, focusing on extending the life of state-owned coal assets, a $1.6 billion Electricity Maintenance Guarantee, and the $400 million Queensland Energy Investment Fund. Key infrastructure includes the CopperString transmission line and new gas-fired generation, while the Pioneer-Burdekin Pumped Hydro project has been cancelled in favor of smaller storage options.
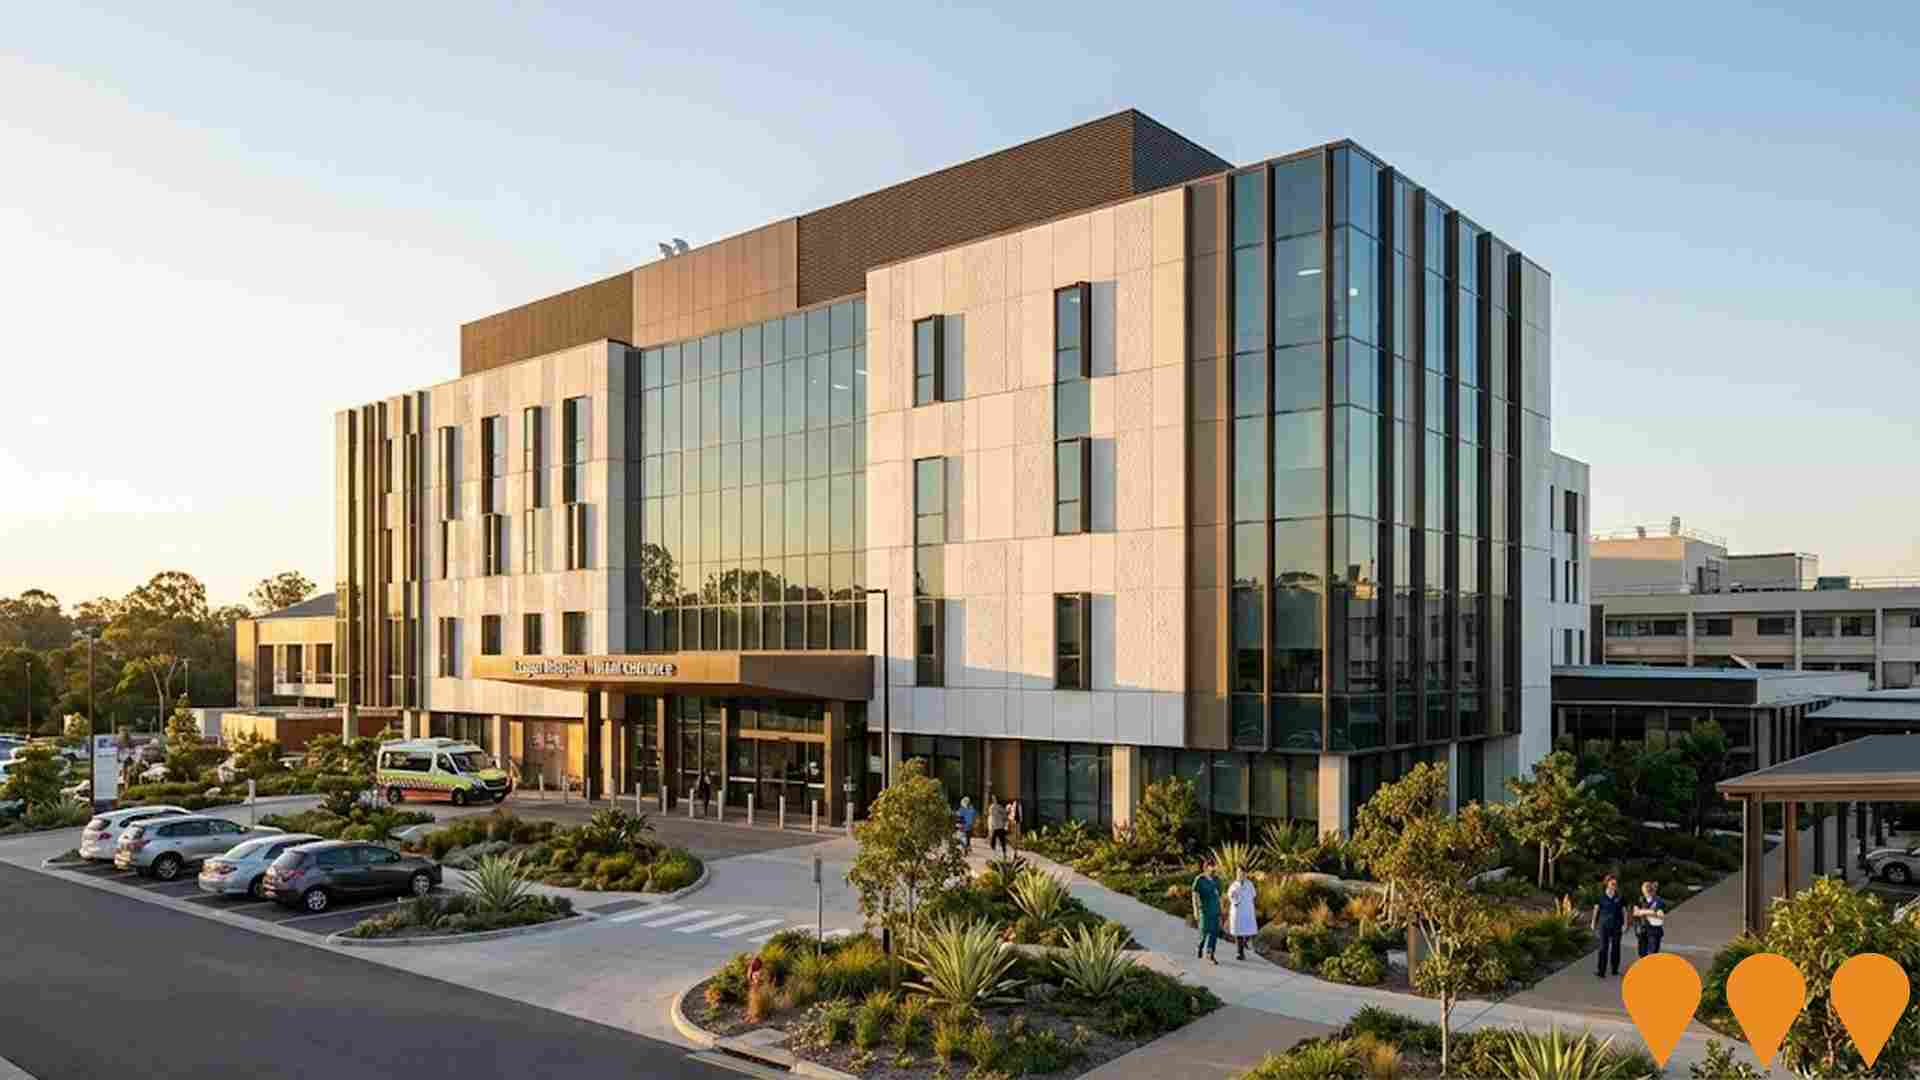
Logan Hospital Expansion
Major $1.16 billion expansion of Logan Hospital delivered in two stages. Stage 1 (completed mid-2025) delivered a new five-storey building with 206 additional beds, cardiac catheterization lab, palliative care unit, medical assessment unit and expanded support services. Stage 2 is under construction and on track for completion in late 2026, adding a new clinical services building with 112 beds, 10 new operating theatres, expanded emergency department, women's and newborns services, and over 1,000 additional car parks. Total project delivers more than 300 new beds and significantly enhanced clinical capacity for the fast-growing Logan-Beaudesert region.
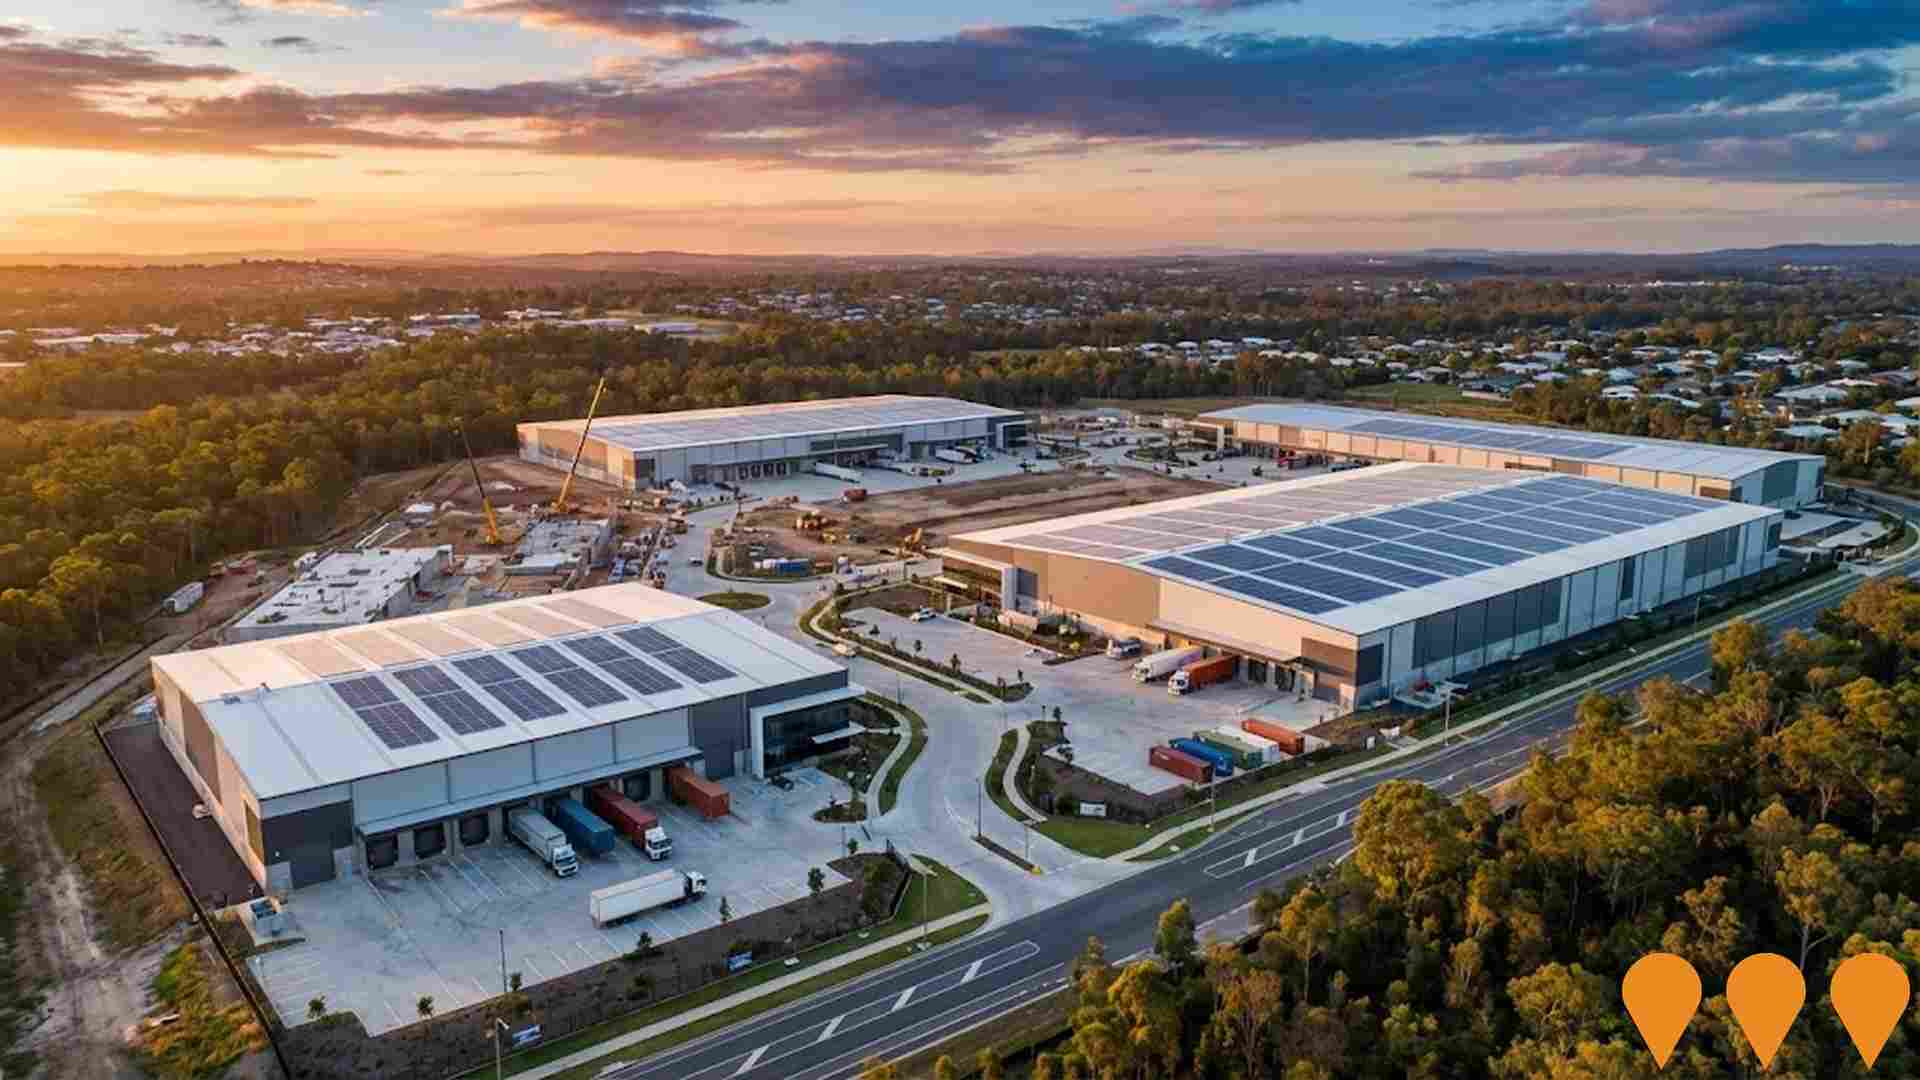
Crestmead Logistics Estate
A $1.5 billion nine-stage industrial estate developed by Pointcorp, delivering 650,000 sqm of warehousing, business, logistics and manufacturing space across 157 hectares. The project is a major industrial growth engine for the south-western Brisbane corridor. Stage 1 was completed and purchased by Mapletree Investments for $90 million to develop a $440 million Mapletree Logistics Park. Stage 2 of Mapletree Logistics Park, adding 37,751 sqm, was due for completion in October 2023, with Stage 3 construction commencing for March/April 2025 occupancy.
Yarrabilba Priority Development Area
Large master-planned community in Logan, Queensland, designated a Priority Development Area (PDA). The overall development is expected to span 20-30 years, providing up to 20,000 dwellings for a population of up to 50,000 residents. Recent activity includes construction on the Yarrabilba Business Park (forecast opening early 2026), the Jimbillunga Drive/Wentland Avenue extension, and a new intersection on Waterford-Tamborine Road (completion mid-2027). Planning is underway for a major Town Centre (Precinct 7) with retail, dining, and commercial uses, including potential high-density development up to 8 storeys.

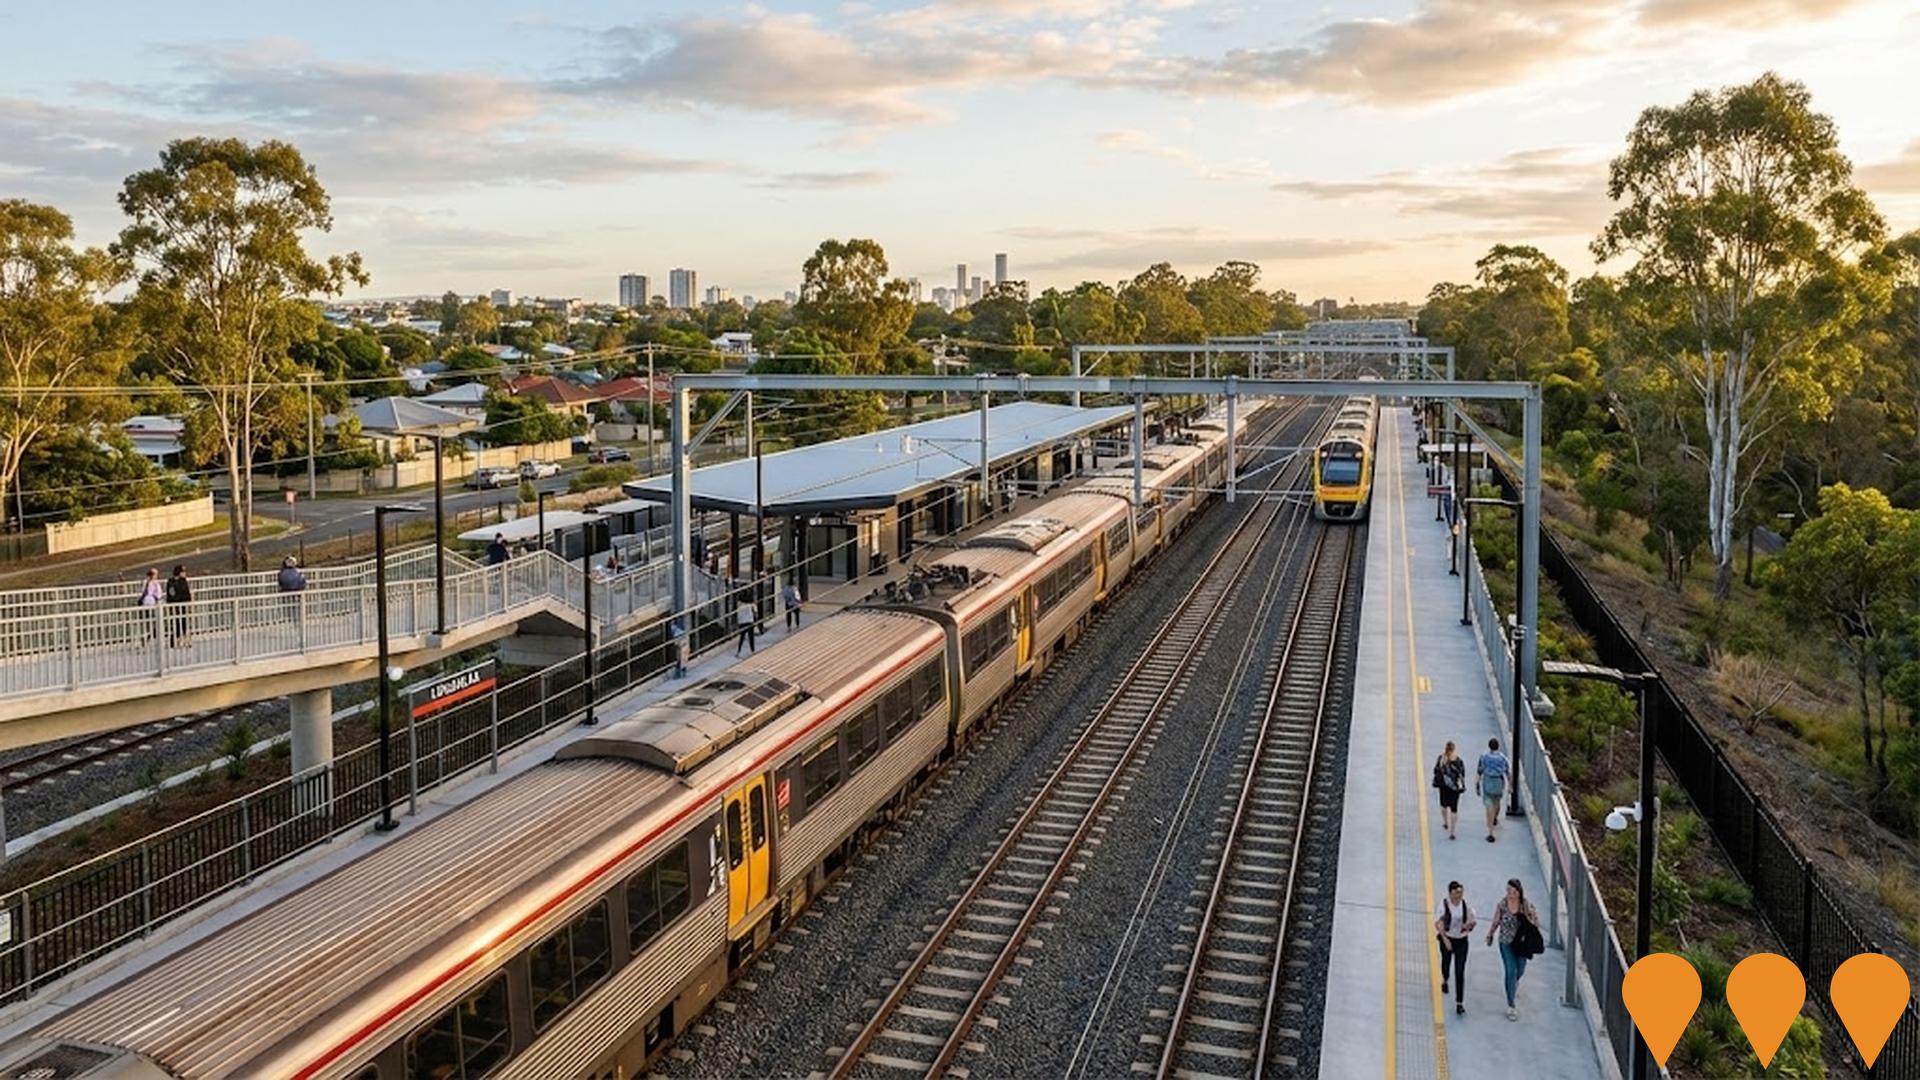
Logan and Gold Coast Faster Rail
The $5.75 billion Logan and Gold Coast Faster Rail project is a jointly funded (50:50) Australian and Queensland Government initiative to upgrade the 20km rail corridor between Kuraby and Beenleigh by adding two additional tracks (doubling from two to four), upgrading nine stations for accessibility (Kuraby, Trinder Park, Woodridge, Kingston, Loganlea, Bethania, Edens Landing, Holmview, and Beenleigh), removing five level crossings, relocating stations at Trinder Park and Loganlea, installing new signalling including ETCS, and providing dedicated active transport facilities and improved road connections. The project will enable more frequent and reliable train services between Brisbane, Logan, and the Gold Coast, supporting population growth and readiness for the Brisbane 2032 Olympics. As of November 2025, the project is in the detailed design and pre-construction phase following the formation of the LGC Rail Alliance (ActivUs consortium with SMEC and WSP) in October 2025; site investigations are underway, early works planned for 2026, and major construction commencing later in 2026, with completion targeted for 2031.
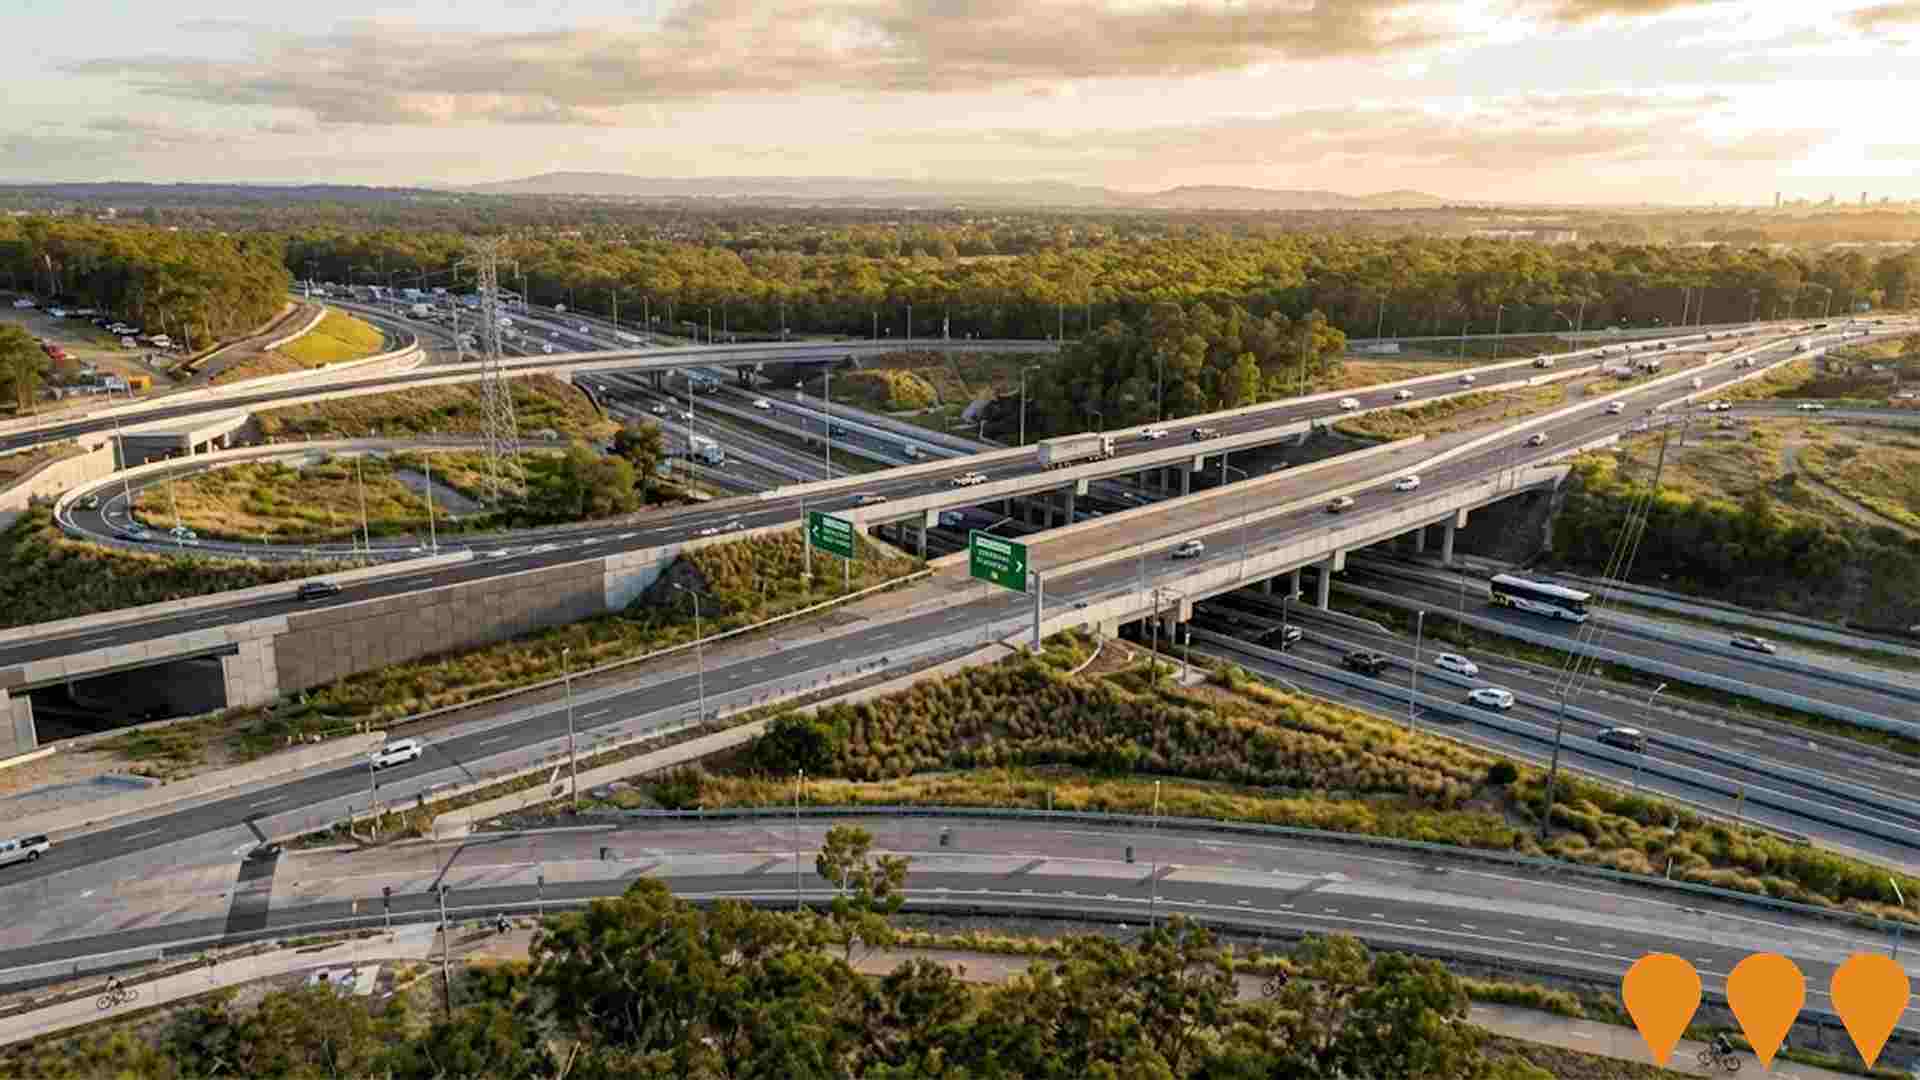
Logan Motorway Upgrade (Gateway Motorway to Murtha Road)
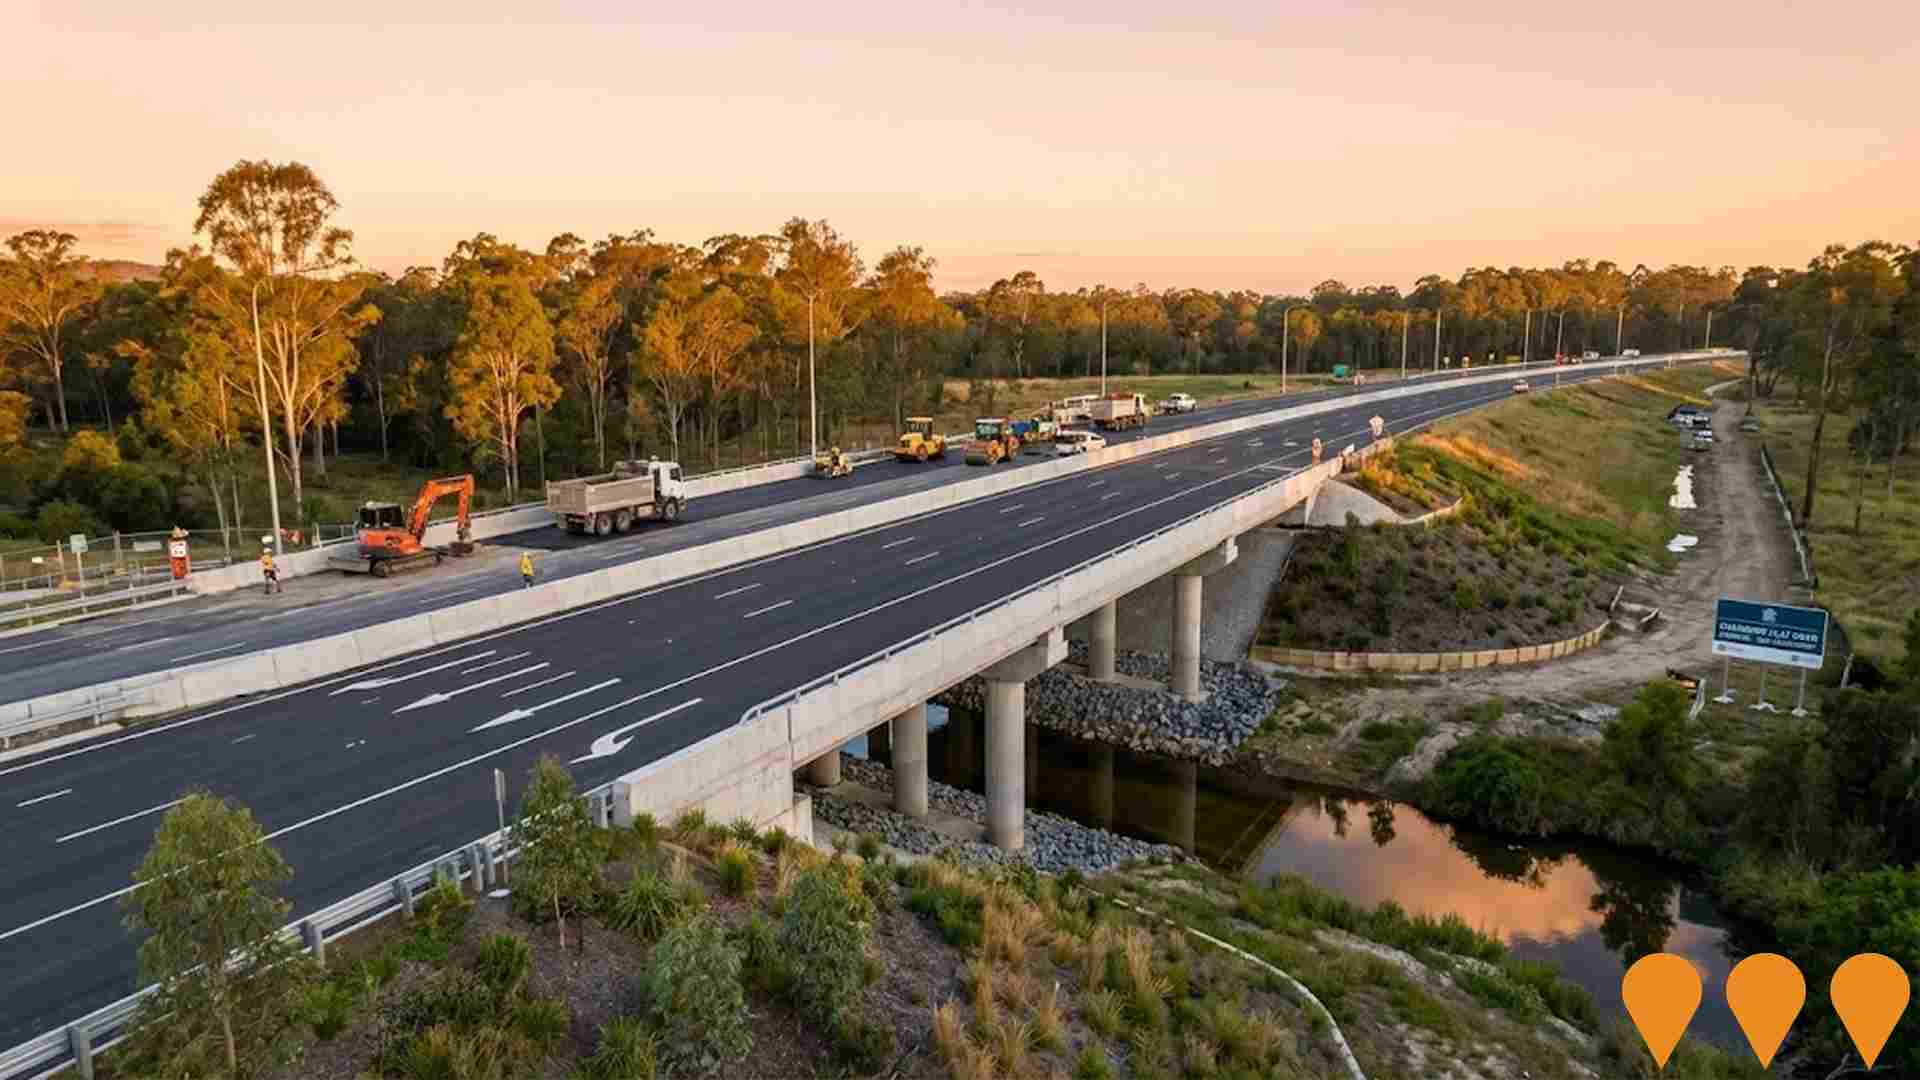
Major motorway expansion project widening Logan Motorway from 4 to 6 lanes between Gateway Motorway and Murtha Road. Includes upgrading 4 interchanges, building new soundwalls, improved cycling and walking paths, and better freight connections to Logan and Gold Coast.
Pan Pacific Recycling Solar Panel Facility
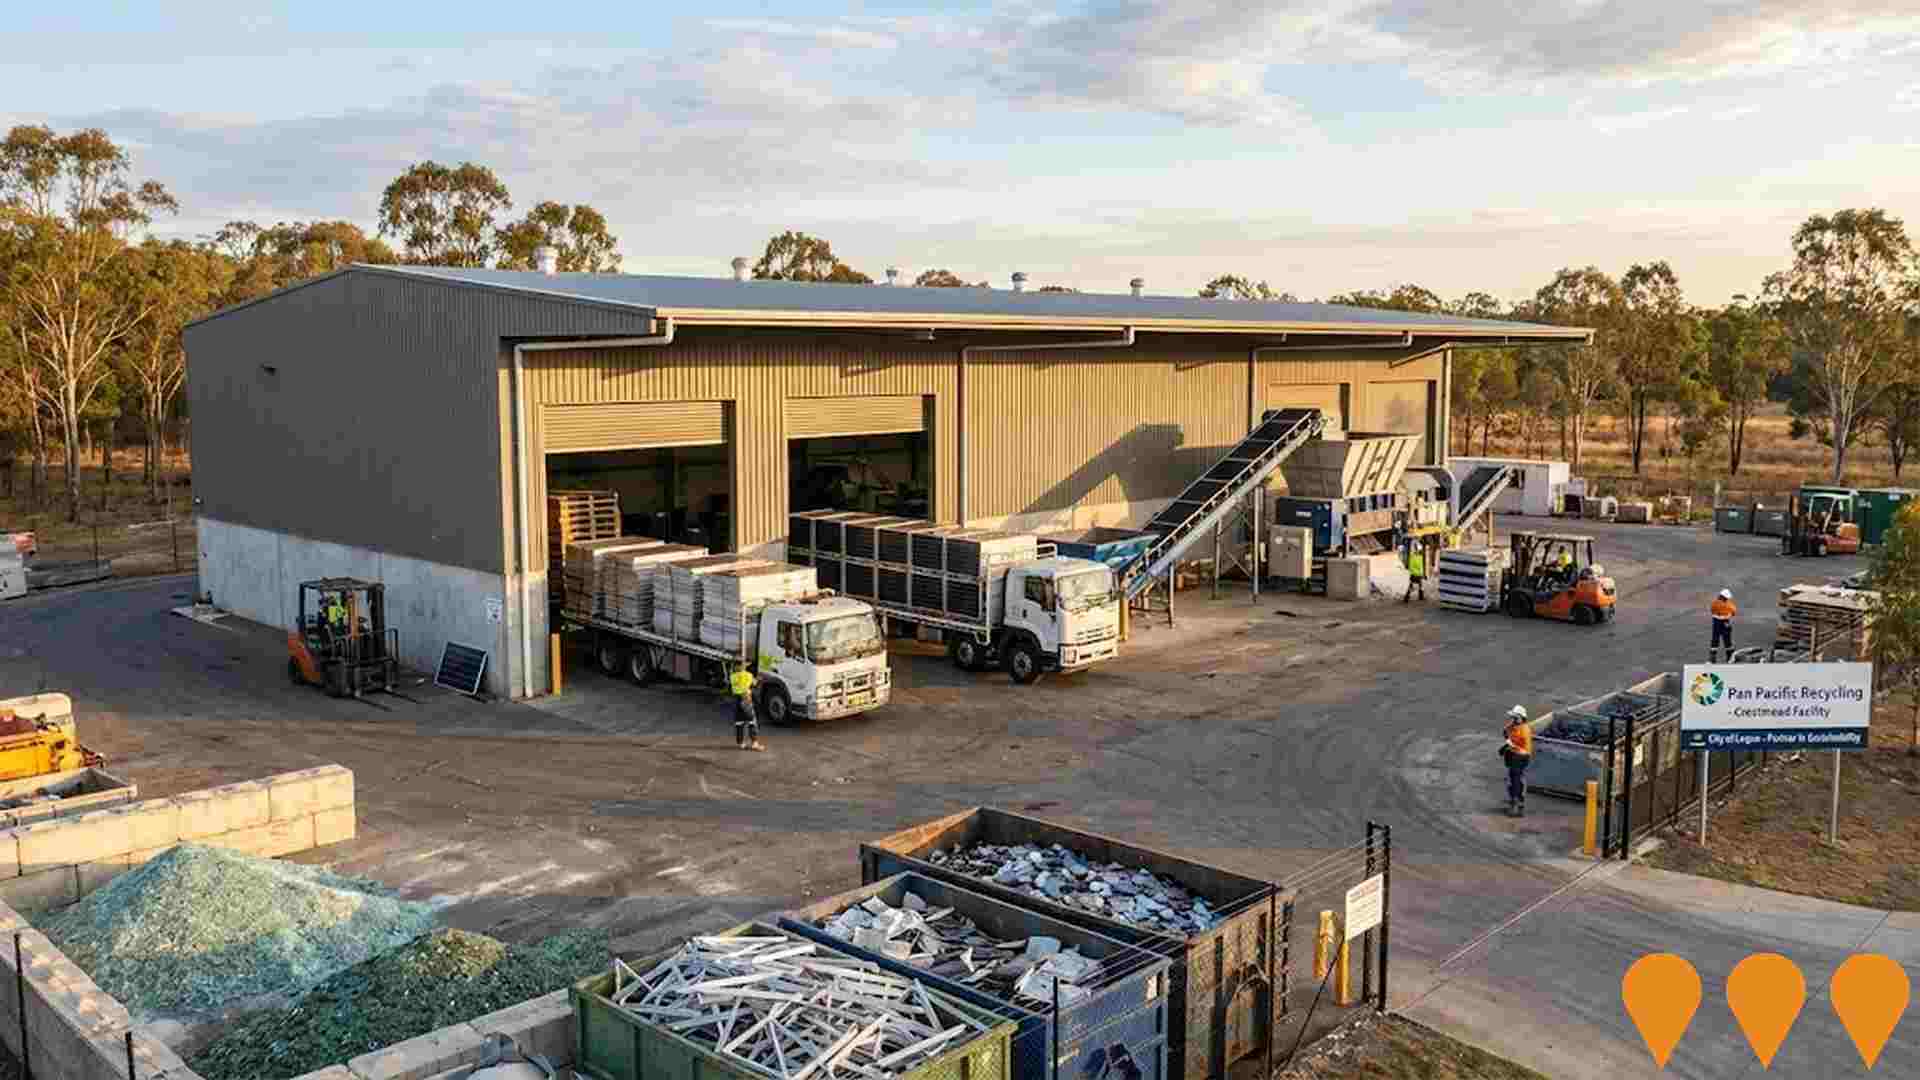
Australia's first commercial solar panel recycling facility planned for Crestmead. Will process end-of-life solar panels to recover valuable materials including silicon, silver, aluminium and glass for reuse in new panels.
Water and Wastewater Capital Works Program
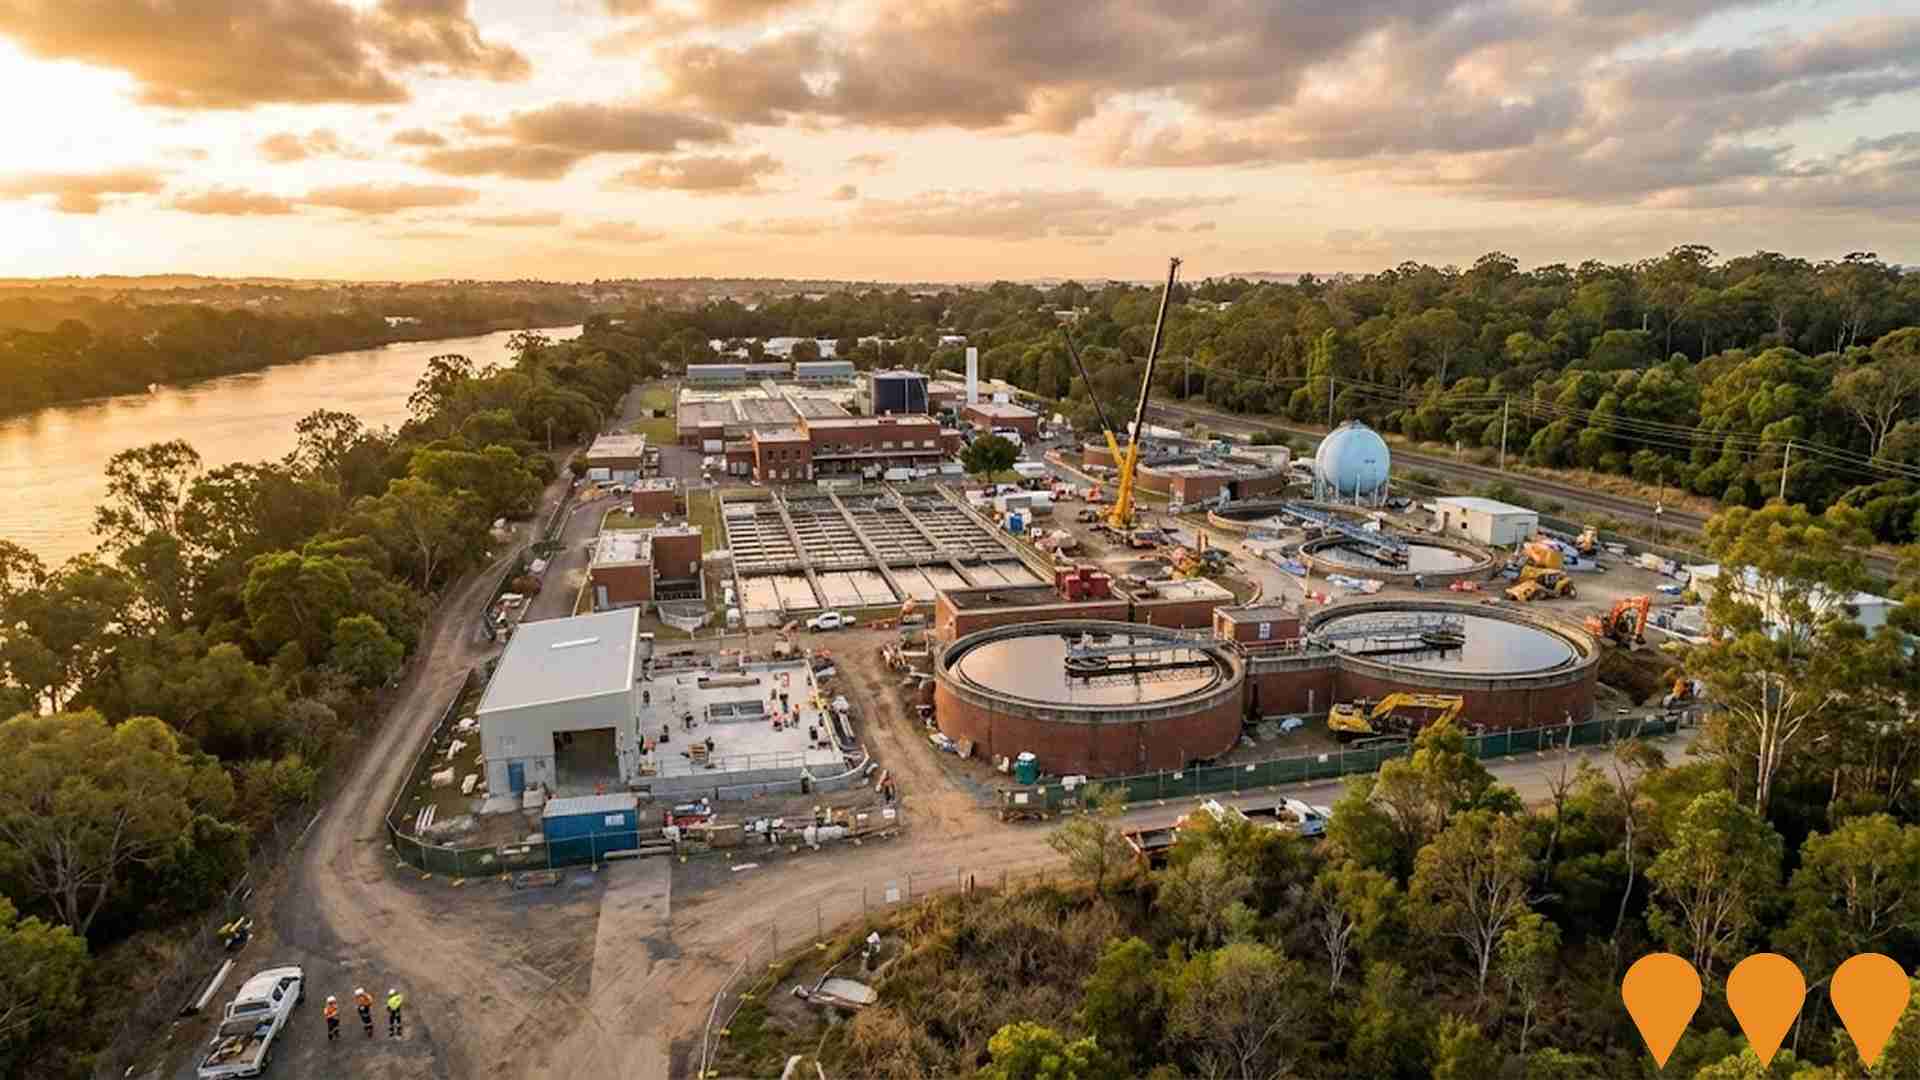
Ongoing capital works program to upgrade water and wastewater infrastructure across Logan City. Includes pipe replacements, pump station upgrades, and treatment facility improvements.
Employment
Employment performance in Crestmead has been below expectations when compared to most other areas nationally
Crestmead's workforce is balanced across white and blue-collar jobs. Manufacturing and industrial sectors are prominent, with an unemployment rate of 6.9% and estimated employment growth of 4.6% over the past year as of September 2025.
In this period, 6,021 residents were employed, with an unemployment rate of 2.9% higher than Greater Brisbane's rate of 4.0%. Workforce participation in Crestmead is significantly lower at 58.8%, compared to Greater Brisbane's 64.5%. Leading employment industries among residents are health care & social assistance, manufacturing, and retail trade. Manufacturing has a particularly strong presence with an employment share twice the regional level.
Conversely, professional & technical services have limited representation at 2.4% compared to the regional average of 8.9%. Many Crestmead residents commute elsewhere for work, as indicated by Census data on working population versus local population. Between September 2024 and September 2025, employment levels increased by 4.6%, while labour force grew by 2.2%, resulting in a 2.1 percentage point drop in unemployment rate. In comparison, Greater Brisbane recorded employment growth of 3.8% and a 0.5 percentage point decrease in unemployment during the same period. State-wide, Queensland's employment contracted by 0.01% between November 2024 and November 2025, with an unemployment rate of 4.2%, closely aligned with the national rate of 4.3%. Looking ahead, Jobs and Skills Australia's national employment forecasts from May-25 project a 6.6% increase over five years and 13.7% over ten years. Applying these projections to Crestmead's current employment mix suggests local employment could grow by 5.7% in five years and 12.3% in ten years, though these are simple extrapolations for illustrative purposes and do not account for localized population projections.
Frequently Asked Questions - Employment
Income
Income figures position the area below 75% of locations analysed nationally by AreaSearch
The Crestmead SA2's median income among taxpayers was $46,263 in financial year 2022. The average income stood at $48,287 during the same period. In comparison, Greater Brisbane had a median income of $55,645 and an average income of $70,520. Based on Wage Price Index growth of 13.99% since financial year 2022, estimated incomes for September 2025 would be approximately $52,735 (median) and $55,042 (average). According to Census 2021 income data, household, family, and personal incomes in Crestmead rank modestly, between the 26th and 34th percentiles. The majority of residents, 38.9% or 5,047 people, fall within the $1,500 - $2,999 income bracket. This is similar to the surrounding region where 33.3% occupy this range. Housing affordability pressures are severe in Crestmead, with only 80.5% of income remaining after housing costs, ranking at the 29th percentile.
Frequently Asked Questions - Income
Housing
Crestmead is characterized by a predominantly suburban housing profile, with a higher proportion of rental properties than the broader region
Crestmead's dwelling structures, as per the latest Census evaluation, consisted of 96.3% houses and 3.7% other dwellings (semi-detached, apartments, 'other' dwellings), compared to Brisbane metro's 89.2% houses and 10.9% other dwellings. Home ownership in Crestmead stood at 16.0%, with mortgaged dwellings at 38.4% and rented ones at 45.6%. The median monthly mortgage repayment was $1,430, below Brisbane metro's average of $1,600. Median weekly rent in Crestmead was $350, compared to Brisbane metro's $360. Nationally, Crestmead's mortgage repayments were significantly lower than the Australian average of $1,863, and rents were less than the national figure of $375.
Frequently Asked Questions - Housing
Household Composition
Crestmead features high concentrations of group households and family households, with a higher-than-average median household size
Family households comprise 78.4% of all households, including 36.2% couples with children, 18.4% couples without children, and 22.1% single parent families. Non-family households account for the remaining 21.6%, with lone person households at 17.0% and group households comprising 4.5%. The median household size is 3.1 people, larger than the Greater Brisbane average of 3.0.
Frequently Asked Questions - Households
Local Schools & Education
Crestmead faces educational challenges, with performance metrics placing it in the bottom quartile of areas assessed nationally
The area's university qualification rate is 8.0%, significantly lower than Greater Brisbane's average of 30.5%. Bachelor degrees are the most prevalent at 6.0%, followed by postgraduate qualifications (1.0%) and graduate diplomas (1.0%). Vocational credentials are common, with 41.5% of residents aged 15+ holding them - advanced diplomas at 9.1% and certificates at 32.4%. Educational participation is high, with 36.2% of residents currently enrolled in formal education.
This includes 14.7% in primary education, 11.4% in secondary education, and 2.7% pursuing tertiary education.
Frequently Asked Questions - Education
Schools Detail
Nearby Services & Amenities
Transport
Transport servicing is low compared to other areas nationally based on assessment of service frequency, route connectivity and accessibility
Crestmead has 34 active public transport stops, all of which are bus stops. These stops are served by five different routes that together facilitate 518 weekly passenger trips. The accessibility of these transport services is considered good, with residents usually located within 260 meters of the nearest stop.
On average, there are 74 trips per day across all routes, translating to approximately 15 weekly trips per individual stop.
Frequently Asked Questions - Transport
Transport Stops Detail
Health
Health performance in Crestmead is lower than average with common health conditions somewhat prevalent across the board, though to a considerably higher degree among older age cohorts
Crestmead faces significant health challenges with common health conditions prevalent across all age groups but to a higher degree among older cohorts. Approximately 46% of its total population (~5,968 people) has private health cover, compared to the national average of 55.3%.
The most common medical conditions are asthma and mental health issues, affecting 10.6% and 9.8% of residents respectively. Conversely, 66.9% of residents report no medical ailments, slightly lower than the Greater Brisbane average of 69.2%. Crestmead has a lower proportion of seniors aged 65 and over (10.0%, or 1,303 people) compared to Greater Brisbane (12.2%). Health outcomes among seniors require more attention due to the specific challenges they face.
Frequently Asked Questions - Health
Cultural Diversity
The level of cultural diversity witnessed in Crestmead was found to be above average when compared nationally for a number of language and cultural background related metrics
Crestmead's population showed high cultural diversity, with 29.6% born overseas and 21.6% speaking a language other than English at home. Christianity was the predominant religion in Crestmead, accounting for 43.9%. Islam, however, was overrepresented compared to Greater Brisbane, comprising 4.6% of Crestmead's population.
The top three ancestry groups were English (24.6%), Australian (23.7%), and Other (14.8%). Notable divergences included Maori at 4.3%, Samoan at 4.1%, and New Zealand at 1.8%.
Frequently Asked Questions - Diversity
Age
Crestmead hosts a very young demographic, ranking in the bottom 10% of areas nationwide
Crestmead has a median age of 29, which is lower than Greater Brisbane's figure of 36 and considerably younger than Australia's median age of 38. The age profile shows that the 5-14 year-olds are particularly prominent at 17.8%, while the 75-84 group is smaller at 3.0% compared to Greater Brisbane. This concentration of 5-14 year-olds is well above the national average of 12.2%. Post-Census data from 2021 shows that the 15-24 age group has grown from 15.2% to 16.5%, while the 75-84 cohort increased from 2.0% to 3.0%. Conversely, the 5-14 cohort has declined from 18.8% to 17.8%. By 2041, Crestmead is expected to see significant shifts in its age composition. The 75-84 age cohort is projected to rise substantially, increasing by 379 people (97%) from 390 to 770. Notably, the combined 65+ age groups will account for 61% of total population growth, reflecting the area's aging demographic profile. On the other hand, both the 0-4 and 25-34 age groups are expected to see reduced numbers.
